

For the Post-Cryo data, we assessed thresholds for the per-frame background and noise metrics as described below.
The thresholds on median signal (w?intMedian), sigma (the larger of w?intSigLTMADMED and w?intI16_84Range, where the former is the low-tail absolute deviation from the median and the latter is one-half the difference of the 84th and the 16th percentile of pixel values), and total number of masked bad pixels (w?mskNumTotBad) on each frame were left unchanged. We discuss the reasons for not changing the thresholds below.
We used ScanFrame data processed as of August 12, 2012, as part of Post-Cryo pipeline tests to assess thresholds. For each of the 235,189 framesets in this data set (984 scans total), we obtained the values of the metrics described above. In Figures 1, 2, and 3 we plot these values as a function of an arbitrary frameset index, which monotonically increases with frameset time of observation.
 |
| Figure 1 - The W1 (upper panel) and W2 (lower panel) median signal plotted against an arbitrary index that increases with frameset time of observation. The horizontal dashed line shows the threshold (w1intMedian < 4,000 and w2intMedian < 3,000), below which framesets were assigned a qn score of 1.0 in both previous and Post-Cryo processing. |
 |
| Figure 2 - The W1 (upper panel) and W2 (lower panel) sigma plotted against frameset index, as in Figure 1. The black symbols are for the low-tail absolute deviation from median, and the red symbols are for one-half the difference in the 84th and 16th percentile of pixel values. The horizontal dashed line shows the threshold (W1 and W2 sigma < 3,000), below which framesets were assigned a qn score of 1.0 in both previous and Post-Cryo processing. |
 |
| Figure 3 - The W1 (upper panel) and W2 (lower panel) bad pixel count plotted against frameset index, as in Figure 1. The horizontal dashed line shows the threshold (w1mskNumTotBad < 150,000 and w2mskNumTotBad < 100,000), below which framesets were assigned a qn score of 1.0 in both previous and Post-Cryo processing. |
There were 129 out of 235,189 framesets in the Post-Cryo test dataset that failed qn because one or more of these metrics exceeded thresholds. Of these 129 framesets, all but 2 were affected by severe Moon artifacts. In the vast majority of cases these moon-affected framesets had a characteristic visual appearance, as illustrated by the example in Figure 4.
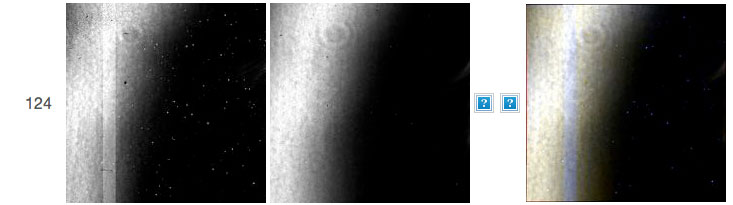 |
| Figure 4 - Frameset 08768a124. This frameset failed qn due to severe moonglow. The majority of framesets that failed qn in the test data set exhibited severe moonglow with remarkably similar visual appearance to this one. |
The 2 framesets that failed qn for reasons other than moonglow were 11984a147 and 12125b148. Both of these were affected by the "exploding pixel effect," of unknown cause, described in the QA Anomalies page.
Apart from moonglow-affected frames, the majority of framesets have values that are < 6 % of the thresholds in median signal (Figure 1) or sigma (Figure 2), or < 25 % of the threshold in number of masked bad pixels. Therefore we determine that the thresholds in Figures 1, 2, and 3 leave adequate room to avoid false positives in normal framesets, including those with tolerable moonglow. Conversely, framesets with severe anomalies in background and noise were found to exceed these thresholds, as is desired.