


VII. 3-Band Cryo Data Release
2. 3-Band Cryo Data Products
d. Single-Exposure Images, Bit Masks, Uncertainty Maps
Users of the image products are referred to the following images that
highlight examples of anomalies. This page shows only those oddities
specific to the 3-band Cryo data;
anomalies and features seen in all WISE data are covered elsewhere.
Note: There is a similar set of image anomalies for Atlas
3-band Cryo images in VII.2.b.i.
i. Image Anomalies and Features
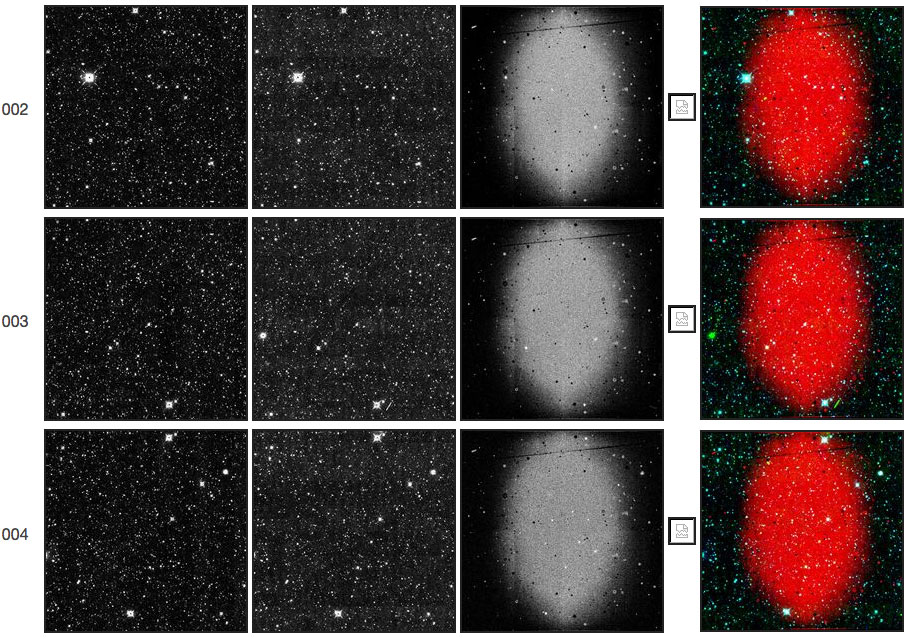
Each figure below shows one row of images per frameset. Each image is
47
arcmin square. From left to right are shown the full single-exposure
frame
for W1, W2, W3, a broken icon where the non-existent W4 data would be,
and a three-color image comprised of
W1(blue)+W2(green)+W3(red). Frameset number is shown at far left. Click
on the thumbnails to see the
images at higher resolution.
Readers are encouraged to use the WISE image service at IRSA to preview
these same images and to download the FITS files for further study. To
aid the reader, values of the frame_ID are provided in the caption of
each figure.
Image examples below are divided into the following categories:
Saturation at W3:
Gradual onset of saturation
Saturation induced by galactic plane crossing
Saturation induced by moon glow
Effects from Bright Objects:
The character of some bright object artifacts in the 3-band Cryo
data was different from that seen in the four-band All-Sky data.
Unusual glints
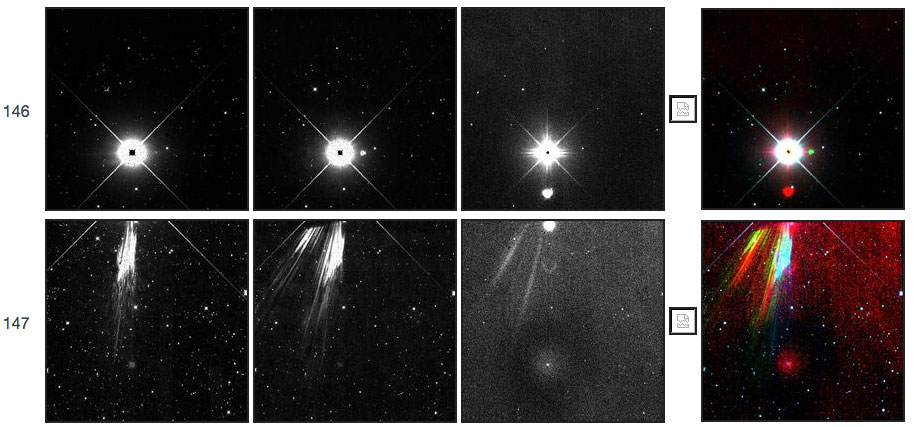 |
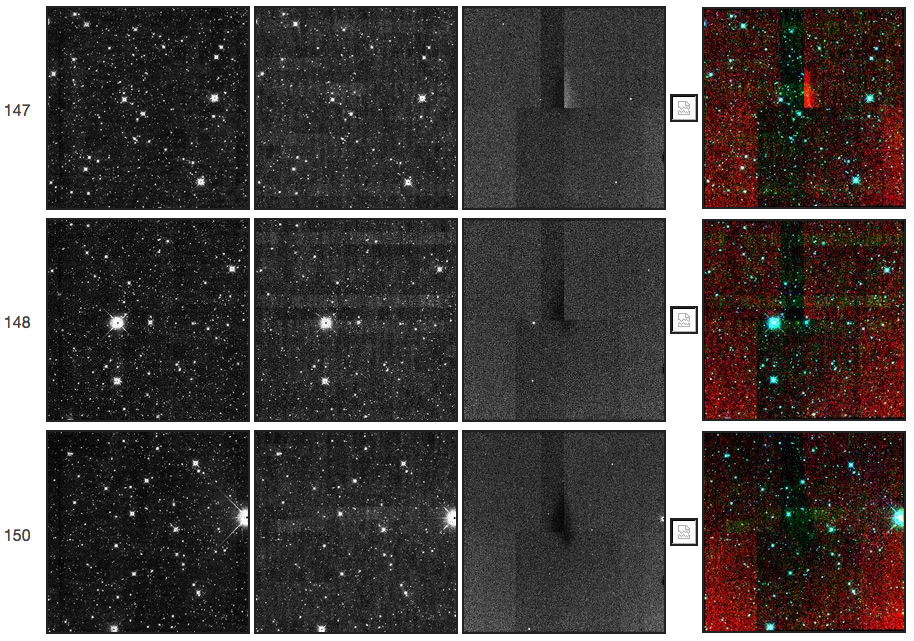
| Figure 1 - Single-exposure frameset 07152a147.
The bright M giant star alpha Ceti (Menkar) in frame 146 produced
elaborate glints in all three bands in the following frame, 147. |
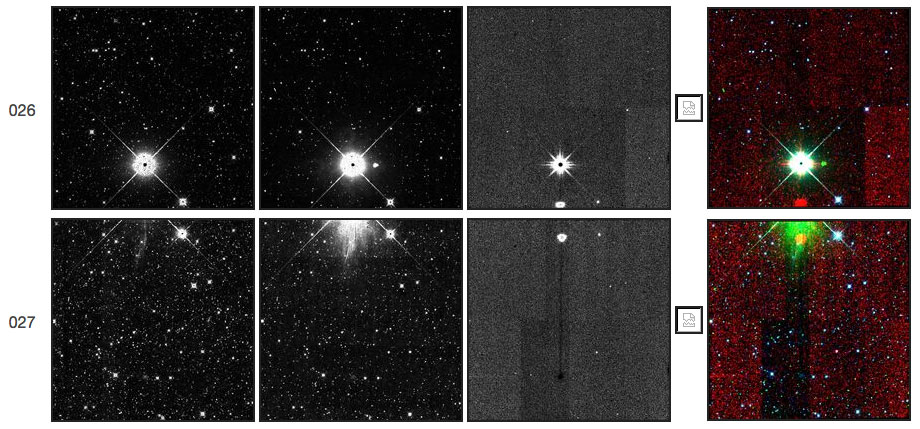 |
| Figure 2 - Single-exposure frameset 07430a027.
The AGB star R Volantis in frame 026 creates a W2-bright glint in
the following frame, 027. |
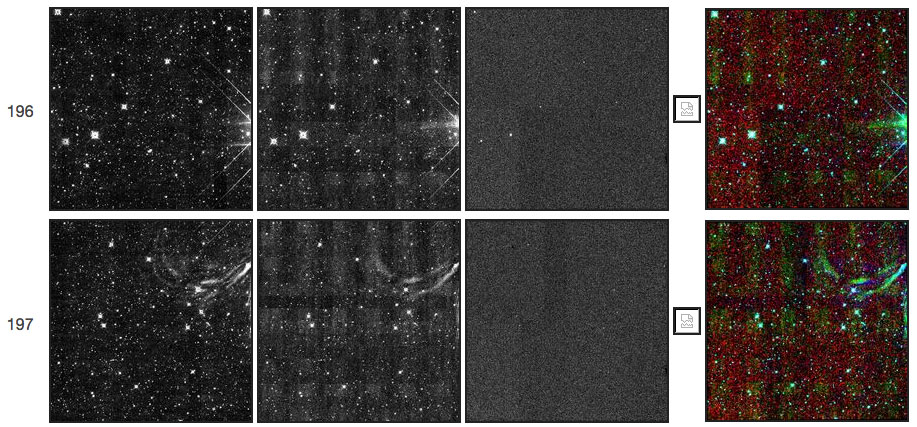 |
| Figure 3 - Single-exposure frameset 07338a197.
A pair of M giants, FQ and FS Serpentis, which are just off frame 196,
create a sickle-shaped glint in W1 and W2 in the following frame, 197. |
Split-quadrant droop
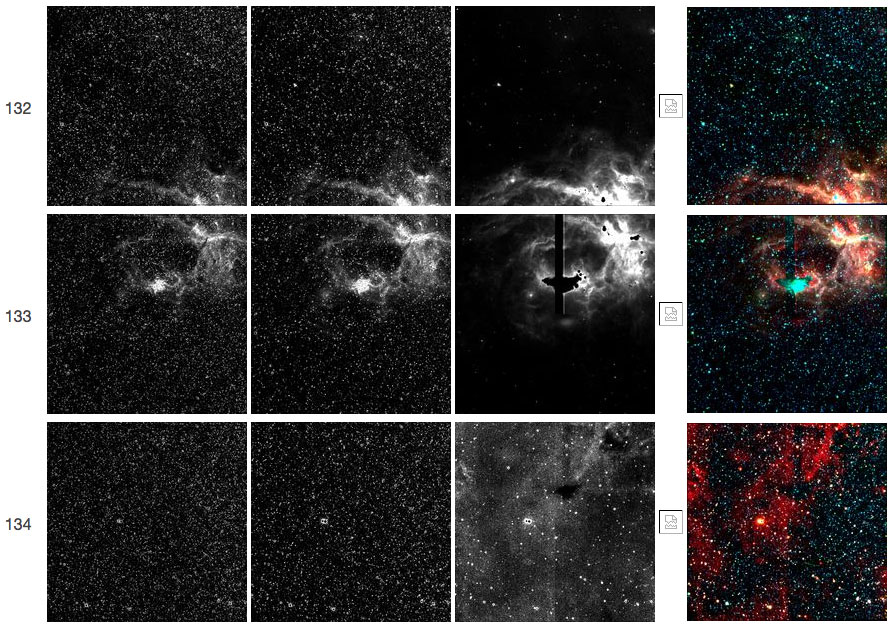 |
| Figure 4 - Single-exposure frameset 08130a133.
W3 saturation caused by the Pismis 24 star cluster and associated nebula
NGC 6357 produces split-quadrant droop in W3 frame 133. |
 |
| Figure 5 - Single-exposure frameset 08340a174.
W3 saturation caused by the heart of the Orion Nebula produces
split-quadrant droop in W3 frame 174. |
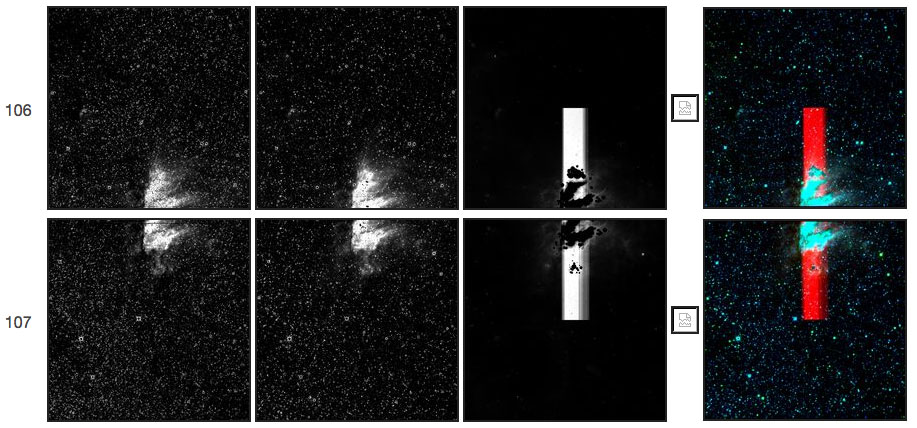 |
| Figure 6 - Single-exposure frameset 08573a106.
W3 saturation caused by the Omega Nebula produces
split-quadrant droop in W3 frames 106 and 107. |
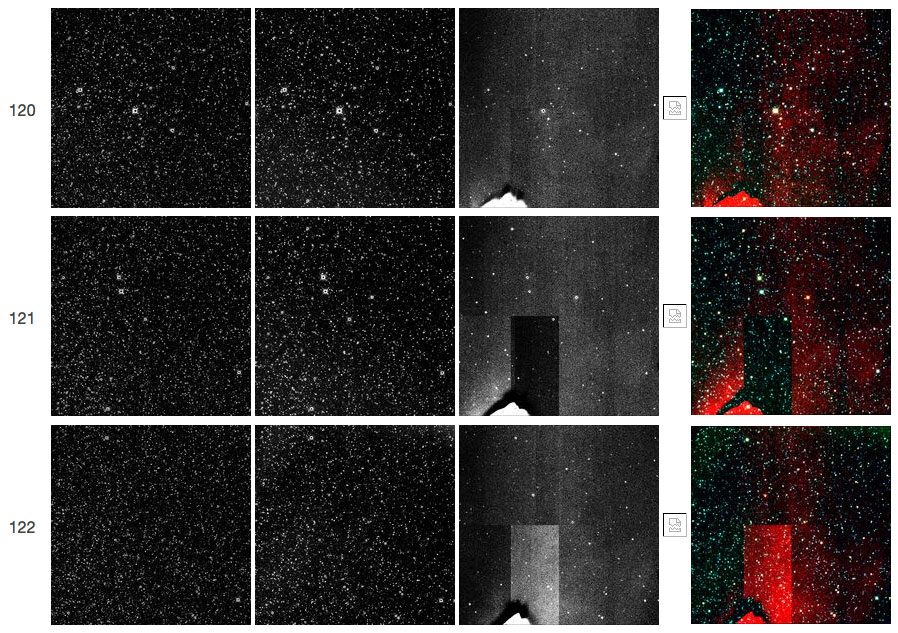 |
| Figure 7 - Single-exposure frameset 08313a120.
W3 saturation caused by a bright satellite passage produces
split-quadrant droop in W3 frame 121. |
Glow from bright star off the array
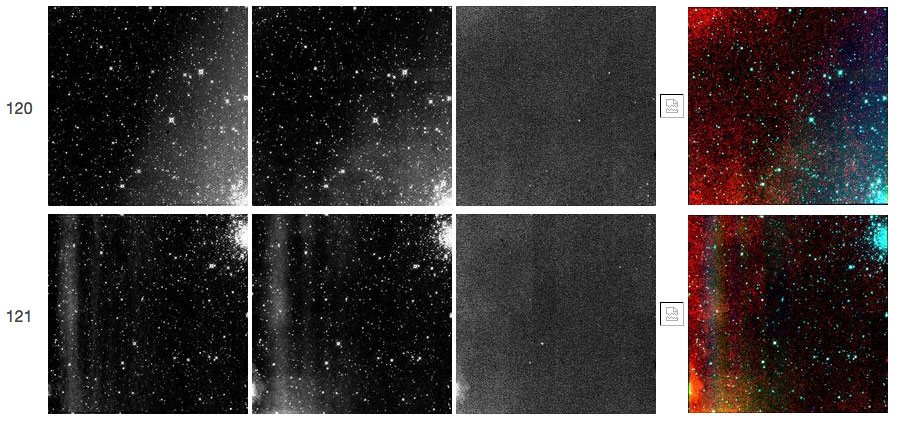 |
| Figure 8 - Single-exposure frameset 07733a120.
Glow across the arrays is sometimes caused by a bright source outside of
the field of fiew, Here, the W1 and W2 frames are contaminated by
glow that is most likely produced by alpha Scorpii (Antares), which
is roughly 1.3 degrees away. |
Saturation at W3:
Saturation in the W3 frames before the change-over
from the 8.8s exposure time to 4.4s exposure time caused several
different effects in the single-exposure data.
Gradual onset of saturation
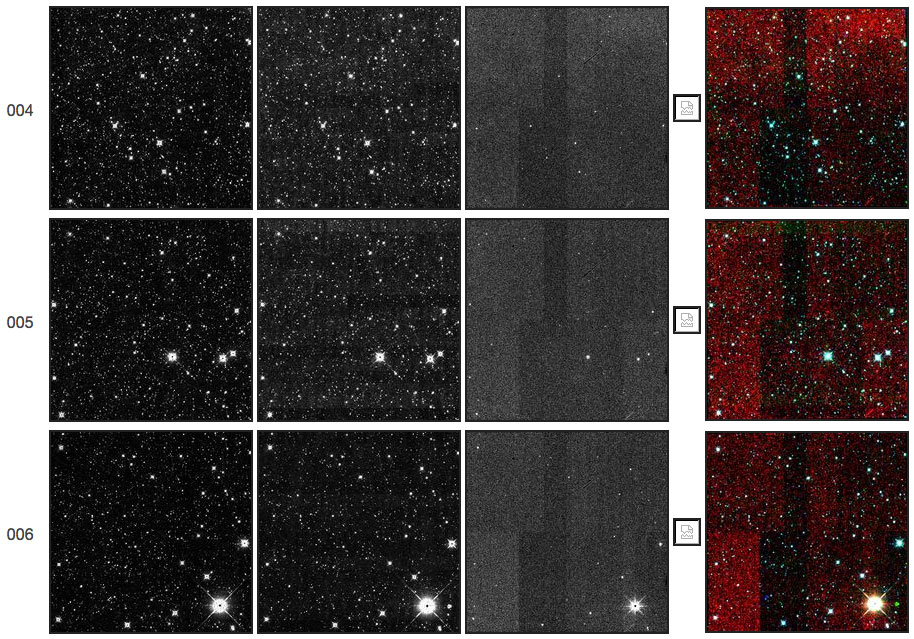 |
| Figure 9 - Single-exposure frameset 07301a004.
As the W3 array moved closer to saturation, several new effects began
to be seen in the images. Here, small mismatches in the
W3 backgrounds from channel to channel are evident. |
 |
| Figure 10 - Single-exposure frameset 07437b150.
As the W3 array moved closer to saturation, several new effects began
to be seen in the images. Here, the channel-to-channel background
mismatch is still evident in W3 along with the onset of saturation
in the middle of the array, which appears as a bright/dark splotch. |
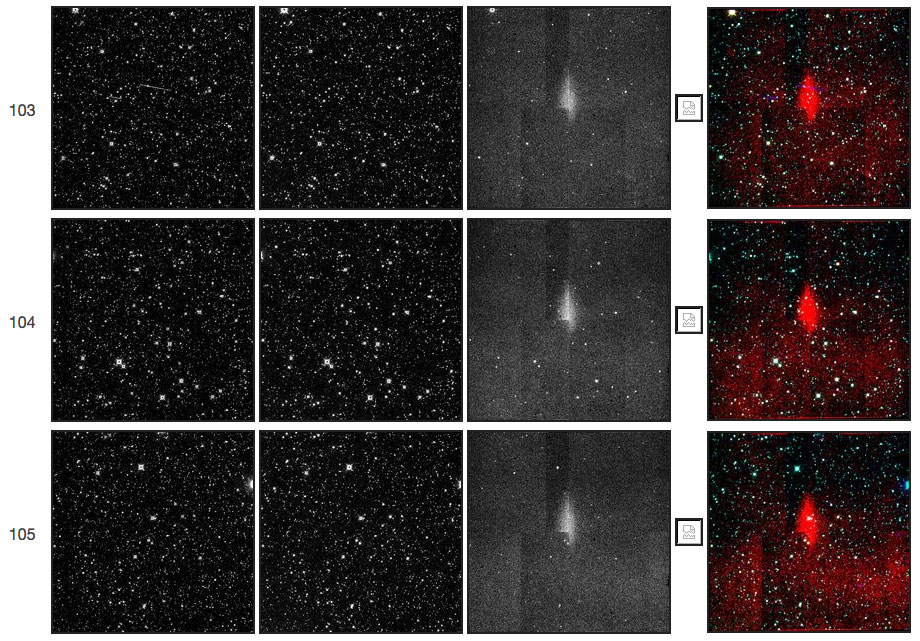 |
| Figure 11 - Single-exposure frameset 07438a103.
As the W3 array moved closer to saturation, several new effects began
to be seen in the images. Here, the bright splotch in W3 is indicative of saturation at array center. |
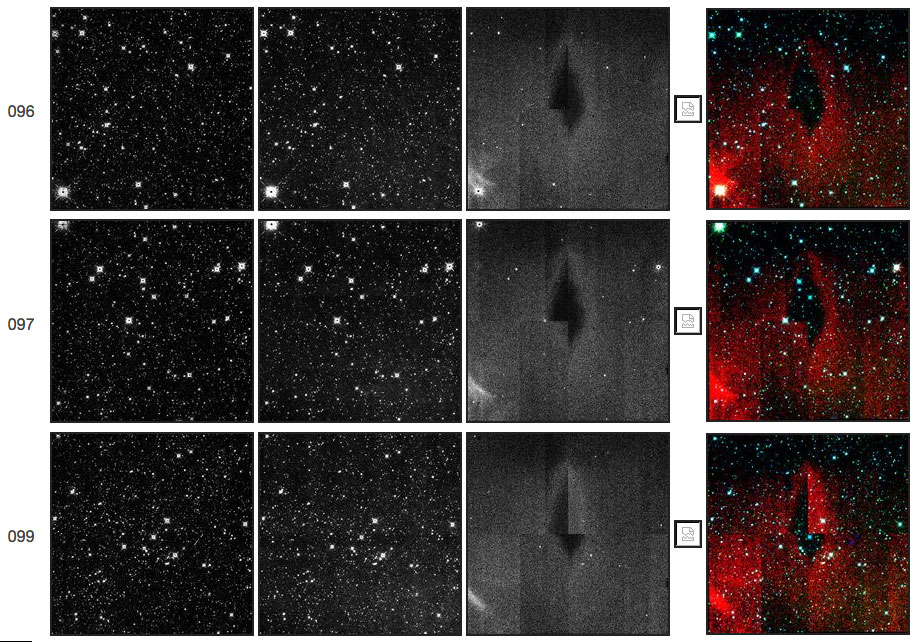 |
| Figure 12 - Single-exposure frameset 07445a096.
As the W3 array moved closer to saturation, several new effects began
to be seen in the images. Here, the center portion of the W3 array
has a large, dark splotch, indicating a sizable area of saturation. |
Saturation induced by galactic plane crossing
 |
| Figure 13 - Single-exposure frameset 08393a053.
As the W3 array moved closer to saturation, several new effects began
to be seen in the images. In this case, scanning over the Galactic
Plane has increased the background levels enough to cause
channel-to-channel background mismatches in W3. |
Sky-offset Mismatch:
At calibration boundaries in W3, dynamical sky offsetting sometimes
did not perform well, leading to W3 background mismatches, and therefore
poor correction to the spatial responsivity.
Poor W3 flat-fielding
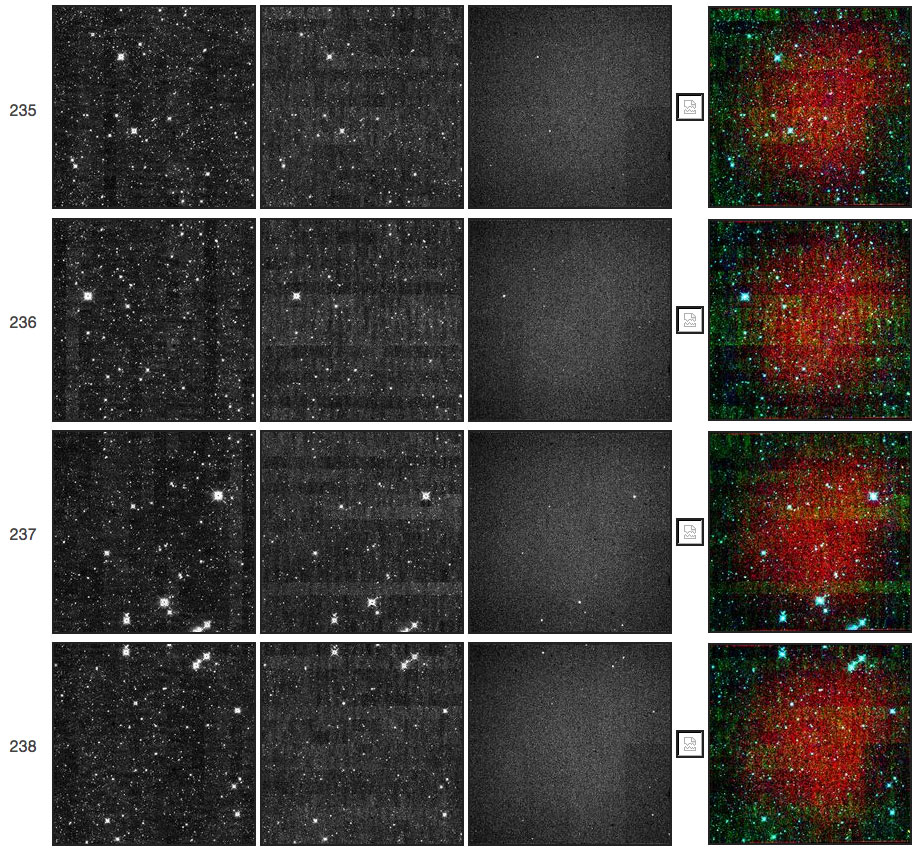 |
| Figure 14 - Single-exposure frameset 07253b235.
The dynamic sky calibration did not work as well near the boundaries
between calibration periods. Here, the W3 background is slightly
non-flat, as seen by the drop-off in the W3 background toward the W3
array edges. |
 |
| Figure 15 - Single-exposure frameset 07270a002.
The dynamic sky calibration did not work as well near the boundaries
between calibration periods. Here, the W3 background is very
non-flat for frames occurring at the beginning of a new
calibration period. |
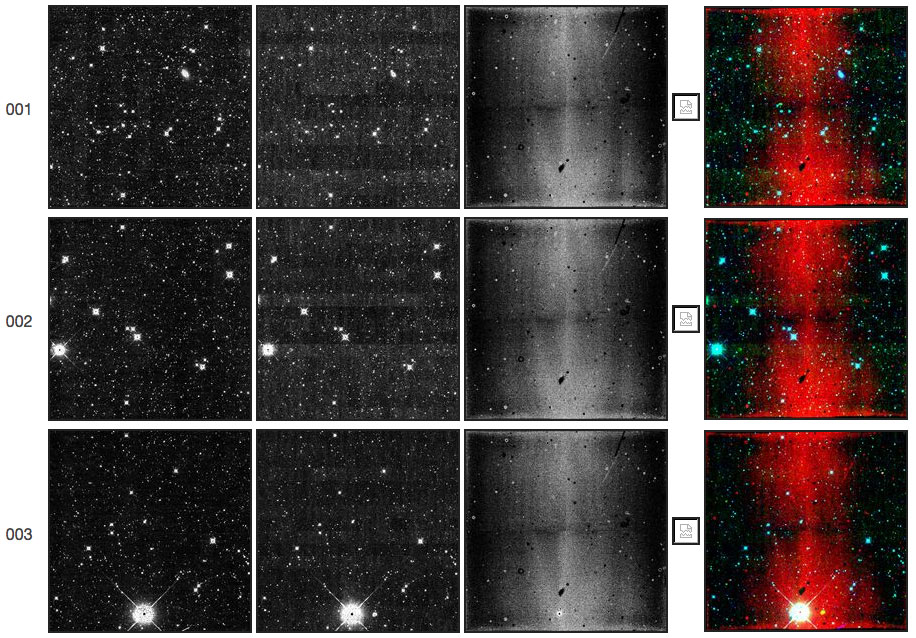 |
| Figure 16 - Single-exposure frameset 07601b001.
The dynamic sky calibration did not work as well near the boundaries
between calibration periods. Here, the W3 background is very
non-flat for frames occurring at the beginning of a new
calibration period. |
Passages of Nearby Objects:
Satellite trails and passages of very nearby objects exhibited
unusual appearances in W3 in 3-band cryo single-exposure data. These effects
were due to the progressive loss of sensitivity in W3 and varying W3
background levels.
Satellite trails
 |
| Figure 17 - Single-exposure frameset 07310a081.
Satellite trails can often appear unusual in the single-band and
three-color frames. Here, a satellite trail saturates the W3 array
along its trail, leaving an odd signature in the three-color image. |
 |
| Figure 18 - Single-exposure frameset 07557b054.
Satellite trails can often appear unusual in the single-band and
three-color frames. Here, a satellite trail begins to traverse the
field of view in frame 054, then is caught by the W3 array as the
scan mirror is flipping back into position for frame 055. Near the kink in the W3
trail in frame 055, a bright, horizontal artifact appears that
traverses the entire W3 array. Latents from the trail are seen in
frame 056. |
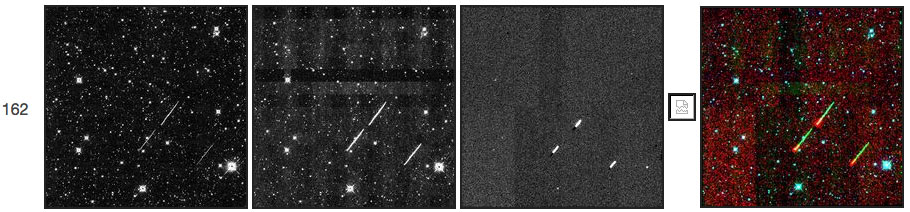 |
| Figure 19 - Single-exposure frameset 07589a162.
Satellite trails can often appear unusual in the single-band and
three-color frames. Because some of the the W3 exposure times (4.4s, 2.2s, or
1.1s) was shorter than that for W1 and W2 (always 8.8s), satellite
trails in W3 can be much shorter than those at W1 and W2, as seen here. |
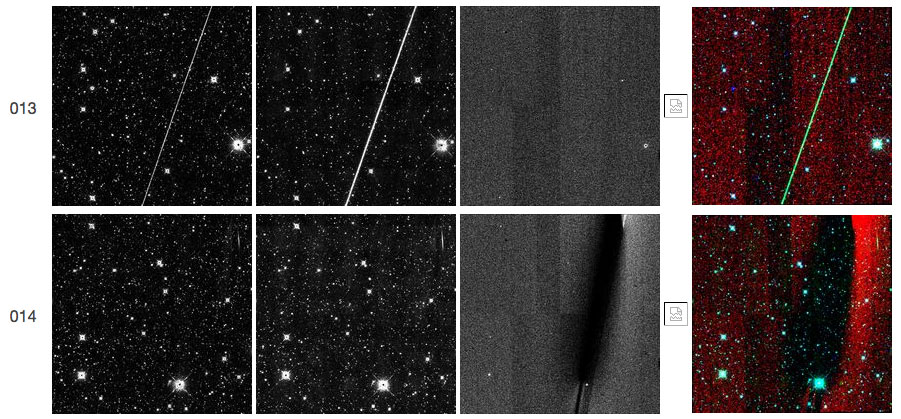 |
| Figure 20 - Single-exposure frameset 07919a013.
Satellite trails can often appear unusual in the single-band and
three-color frames. Here, the shorter exposure time in the W3 array
means that the satellite trail is completely missed in the W3 image
for frame 013. Between readouts, however, the satellite went through
the field of view and left a nasty, dark latent in the W3 image in
frame 014. |
 |
| Figure 21 - Single-exposure frameset 08313a231.
Satellite trails can often appear unusual in the single-band and
three-color frames. Here, a dark latent from a satellite trail in W3
has an associated bright artifact crossing the W3 array horizontally
(as also seen in Figure 18, above). |
Very nearby object
 |
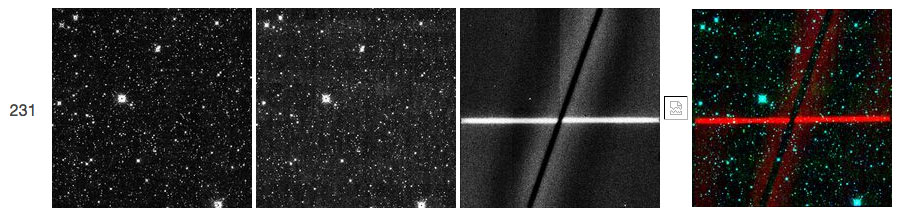
| Figure 22 - Single-exposure frameset 07949b230.
The passage of what is presumably a small object very near the spacecraft
and bright, particularly in W3, can flood the arrays
with light and produce unusual aftereffects. Such objects may simply be
flecks of paint or other small debris. As seen here, an object has
blasted the arrays in frame 230, leaving distinct imprints in the W2
and W3 arrays in frame 231. The arrays quickly return to normal,
however, as seen in frame 232. |
Electronic Artifacts:
Some electronic artifacts seen in the 3-band cryo single-exposure data
were of unexplained origin. Although these resembled similar effects
seen in 4-band cryo data, their appearance is somewhat different.
TV-test pattern
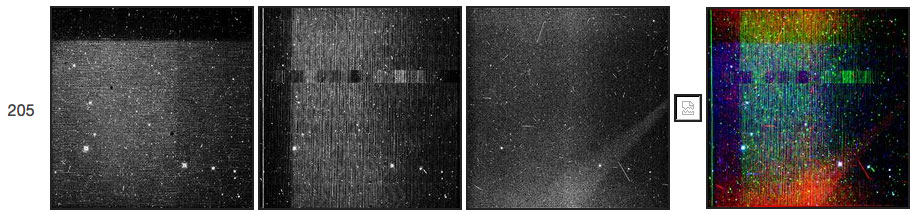 |
| Figure 23 - Single-exposure frameset 07161b205.
Occasionally, an odd electronic artifact is seen in a single set of
frames and the origin is unknown, although it is suspected that the
passage of a small, bright object near the spacecraft, as in Figure
22, might be the culprit. In this example, all three arrays suffer
from odd electronic noise that is confined to a single set of images. |
Last update: 08 June 2012