
| Coverage Simulations for WISE Detector Acceptance Testing | |
In support of WISE detector acceptance testing, simulated depth-of-coverage maps have been generated using bad pixel masks provided by the WISE project science office. The objective of these simulations is to help assess the impact of the bad pixel number and clustering on achieved WISE sky coverage.
Important Note - These simulations are not intended to represent what will be the net sky coverage from actual WISE observations. They make use of approximate mission design parameters and simple image coverage combination algorithms that may not be representative of the actual parameters.
The coverage maps generated by the procedure described above are 2048x1024 pixel FITS format images that represent the depth-of-coverage over two adjacent WISE fields-of-view. The pixel values in each maps are the accumulated number of coverages in that pixel (for Test A, the pixel is the accumulated exposure time). For Test B runs and later, the values will range from 0 to n, where n is the total number of coverages on the pixel. For the Test A run, pixel values are 0 to n*8. 8 seconds is used as the exposure time for simplicity. The actual net exposure time is 8.8 sec.
The simulations do not take into account the following effects that can both increase and decrease achieved coverage.
A brief summary of the results from each simulation are given below. Table 1 contains the basic parameters of each test, including the mask image used, array orientation (rotation), in-orbit and cross-orbit step sizes, orbit frame phase, and the number of orbits dropped to simulate SAA avoidance maneuvers. Click on the "X" in the "FITS map" column to download the gzip'd Coverage Map FITS image.
Following Table 1 are basic results from each test set. These include
a simple histogram of the coverage statistics and JPEG views of the resulting
coverage maps. The coverage histograms tables give the fraction of
pixels having the specified depth-of-coverage (or for Test run A, exposure
times in integer multiples of 8 sec).
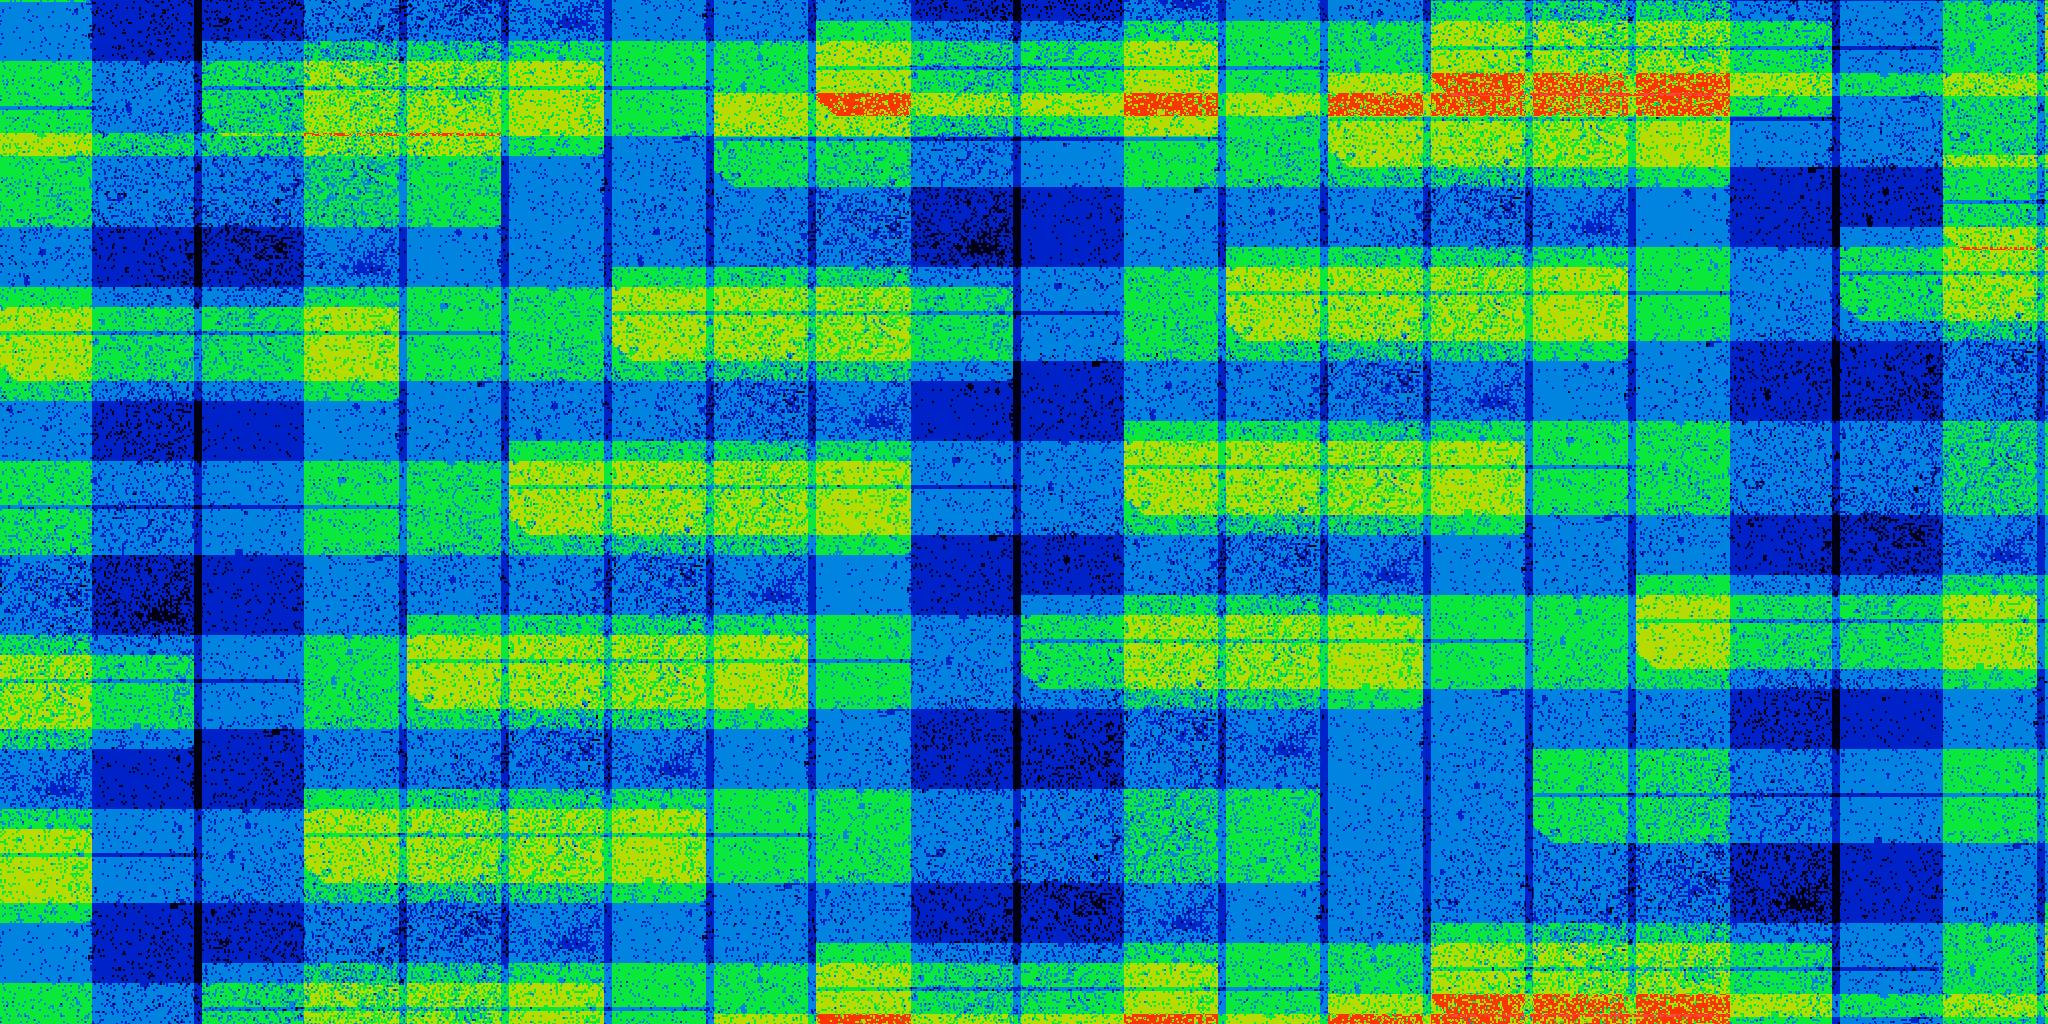
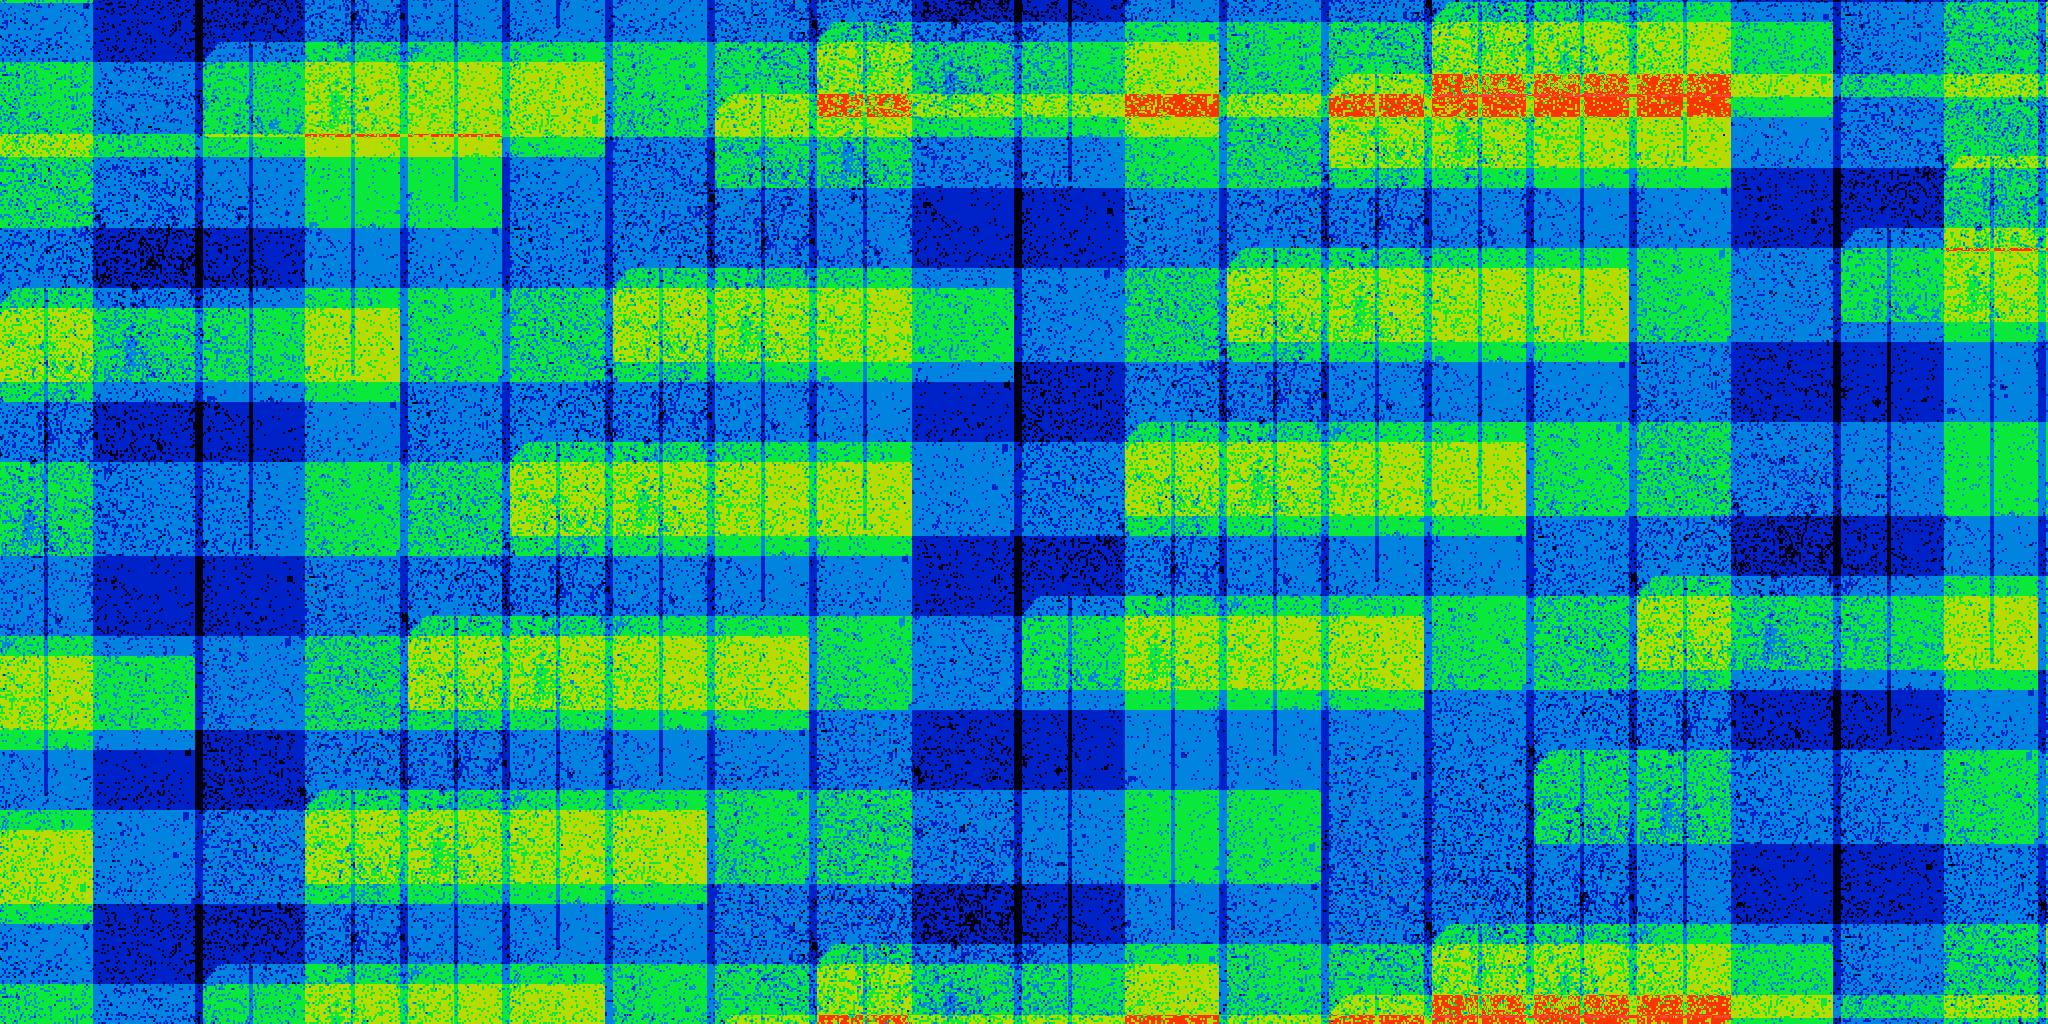
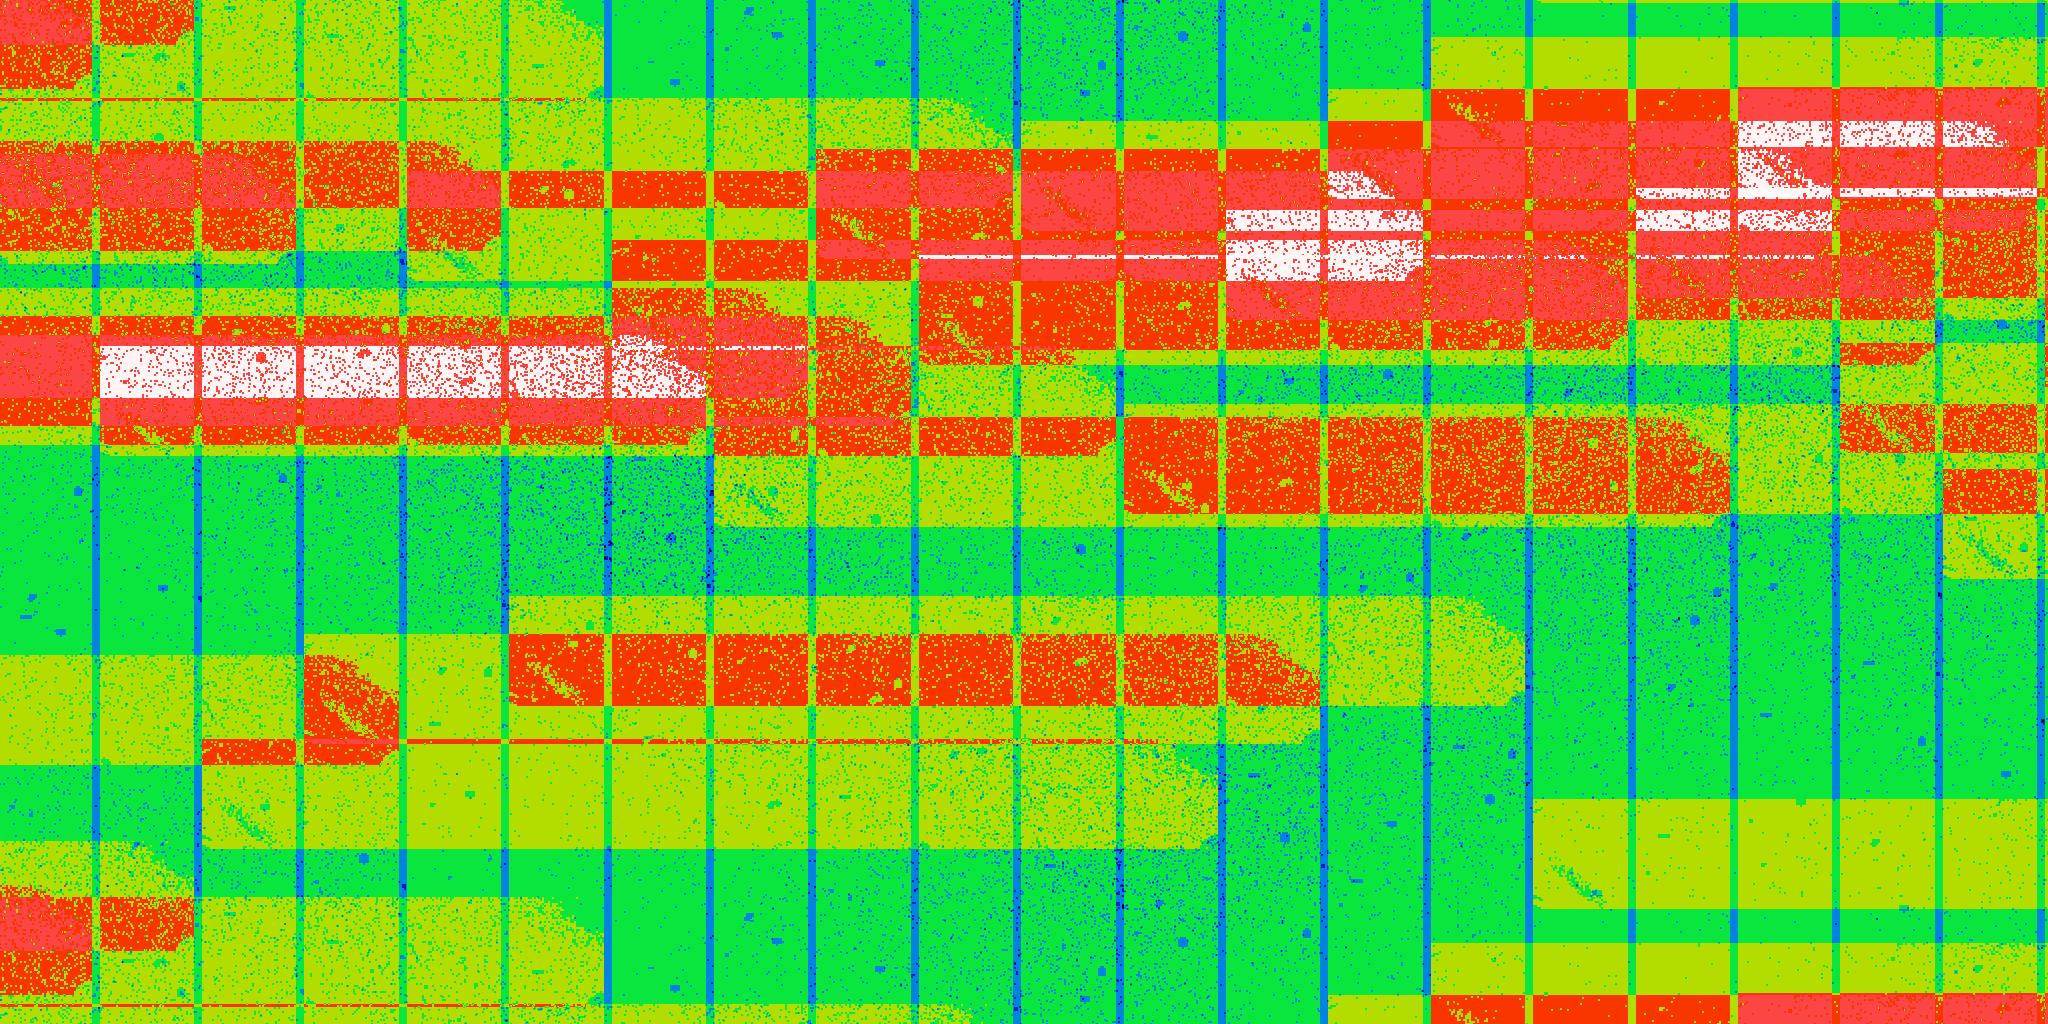
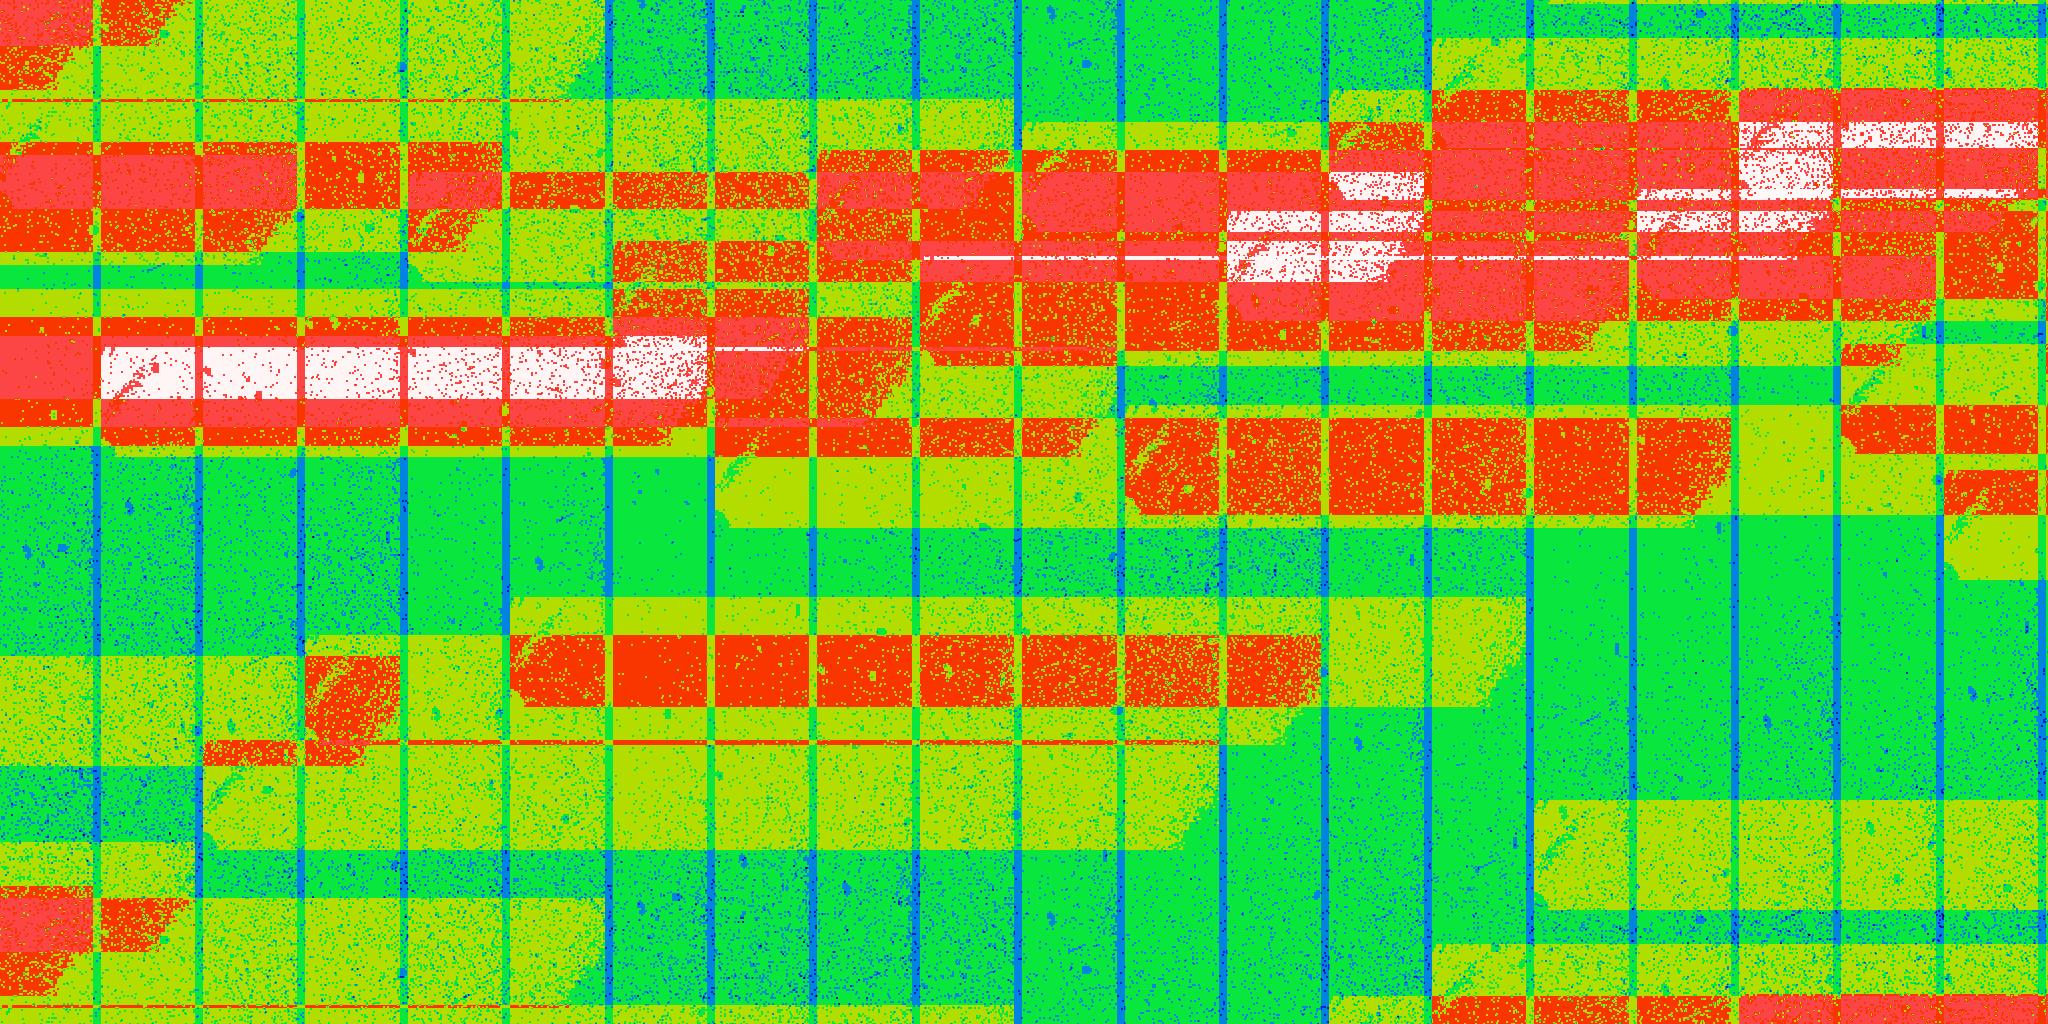
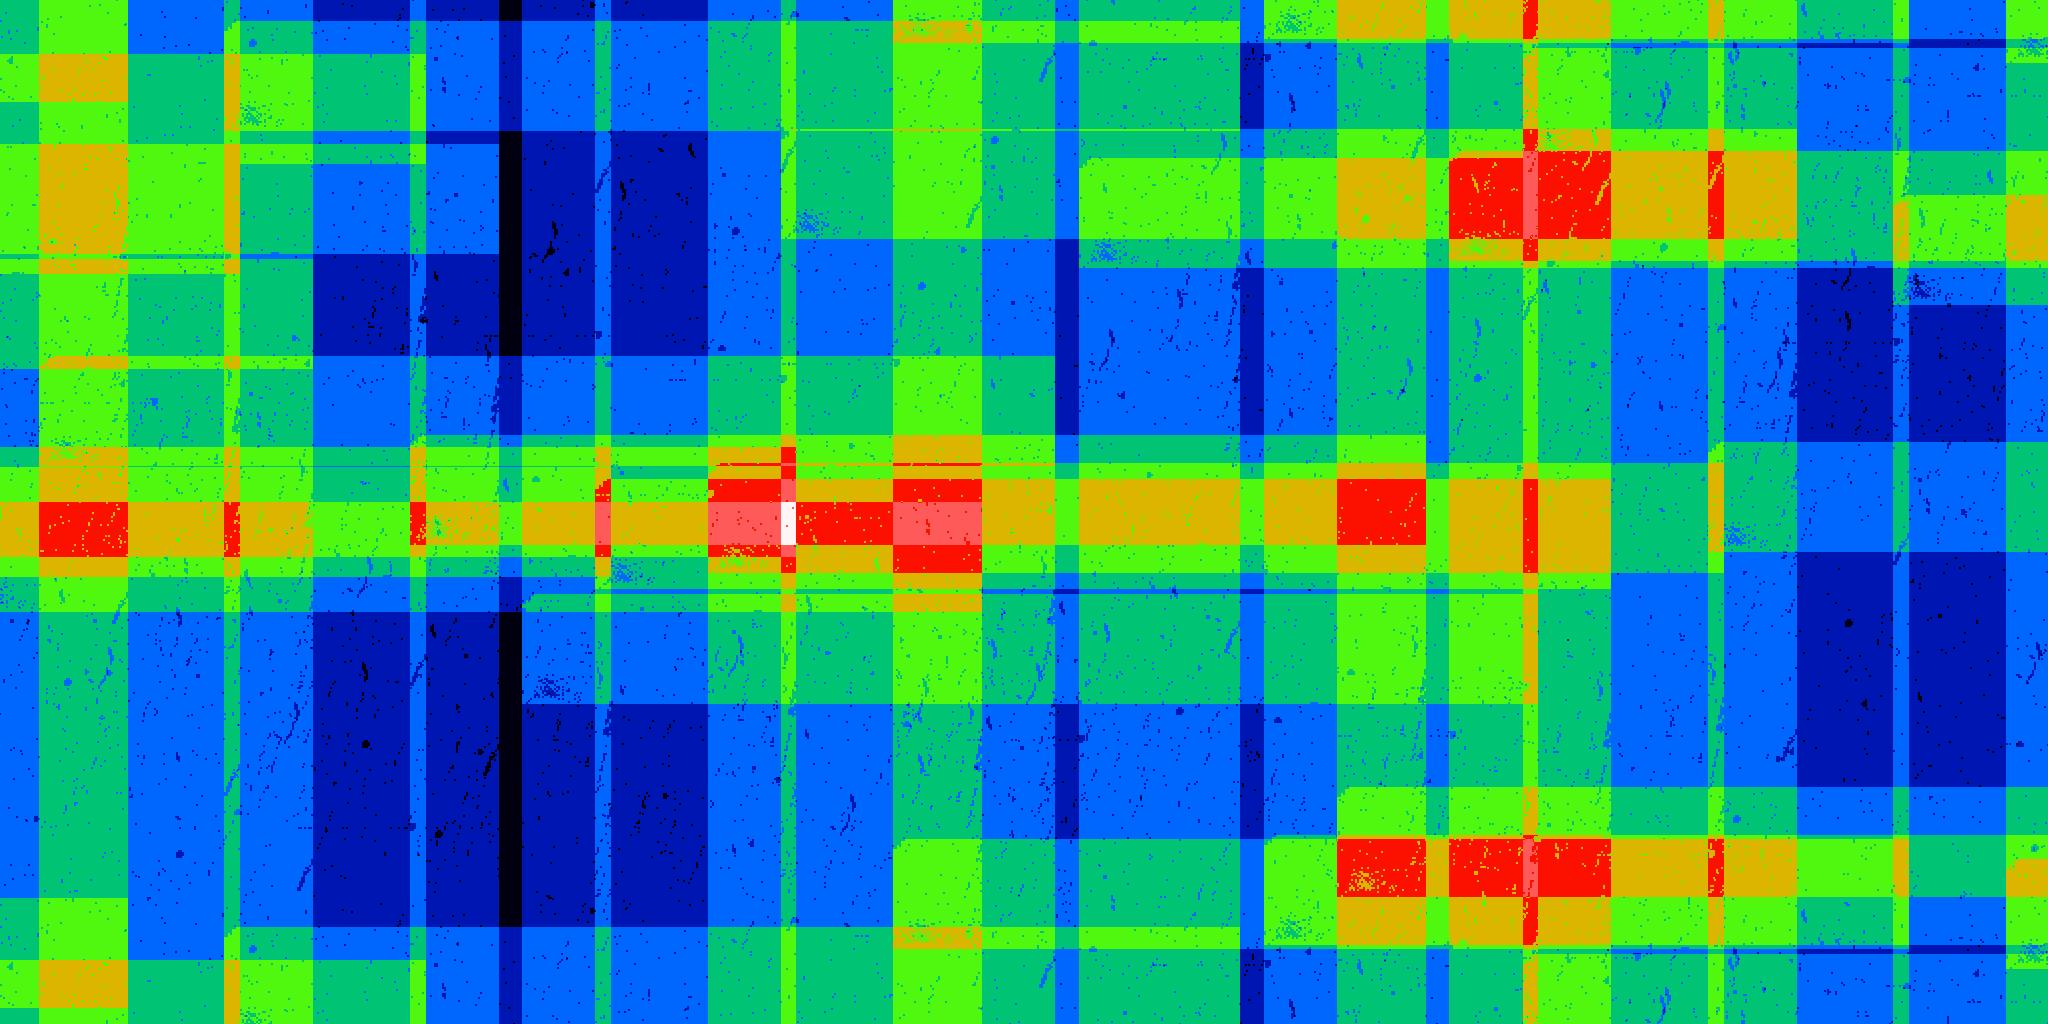
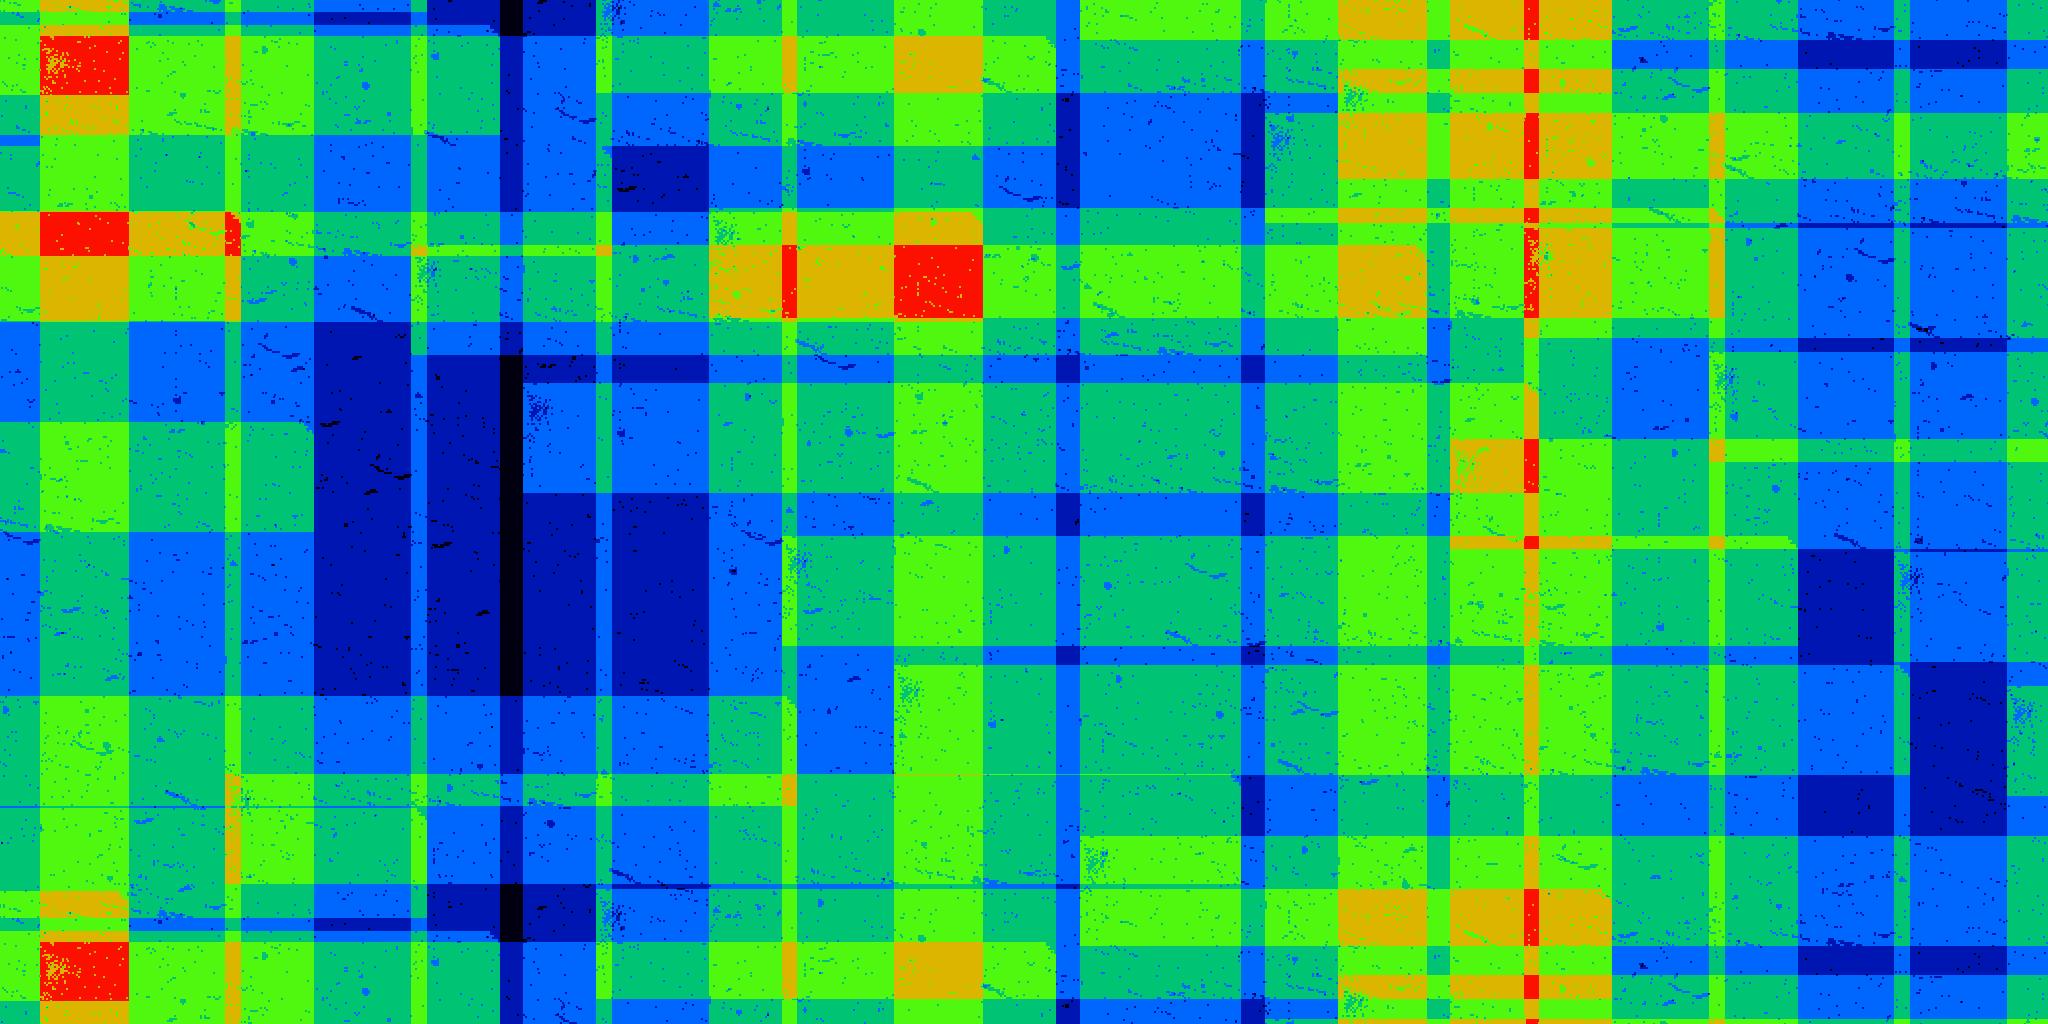
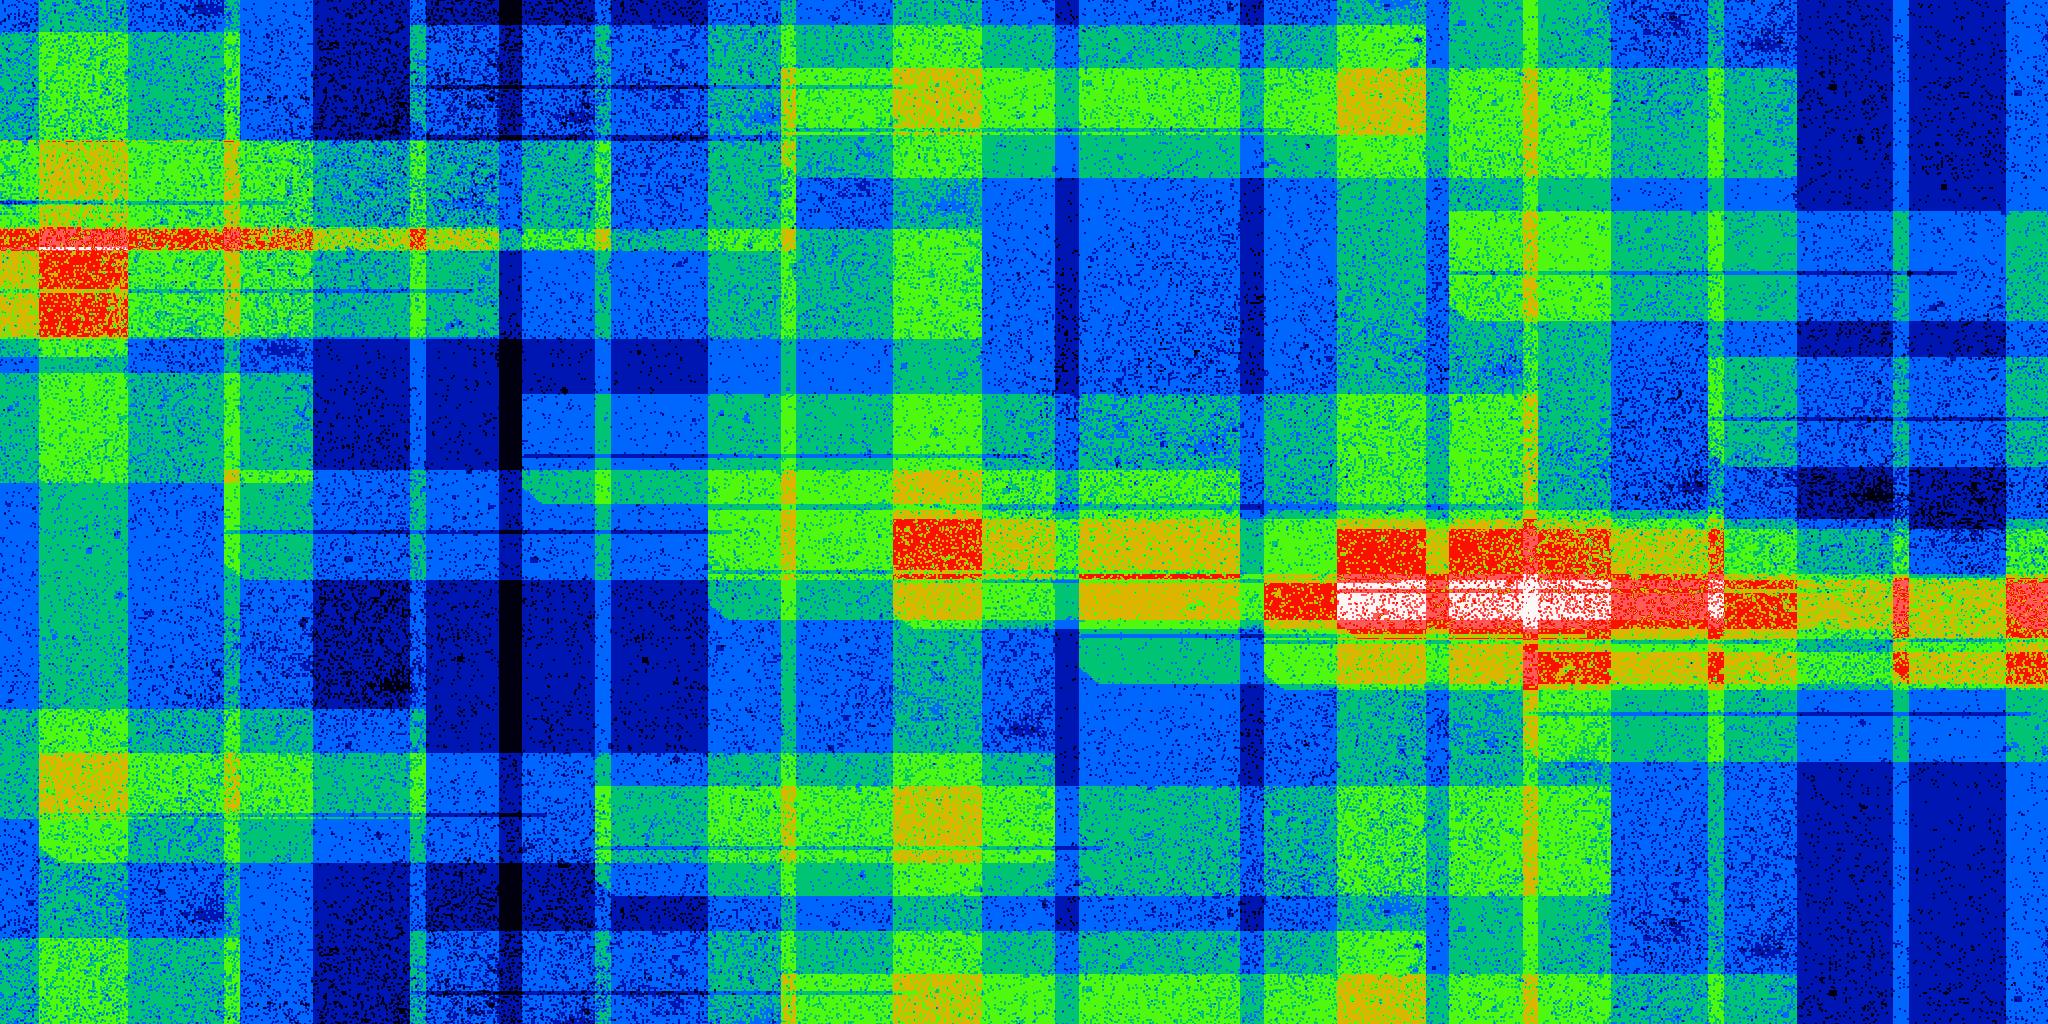
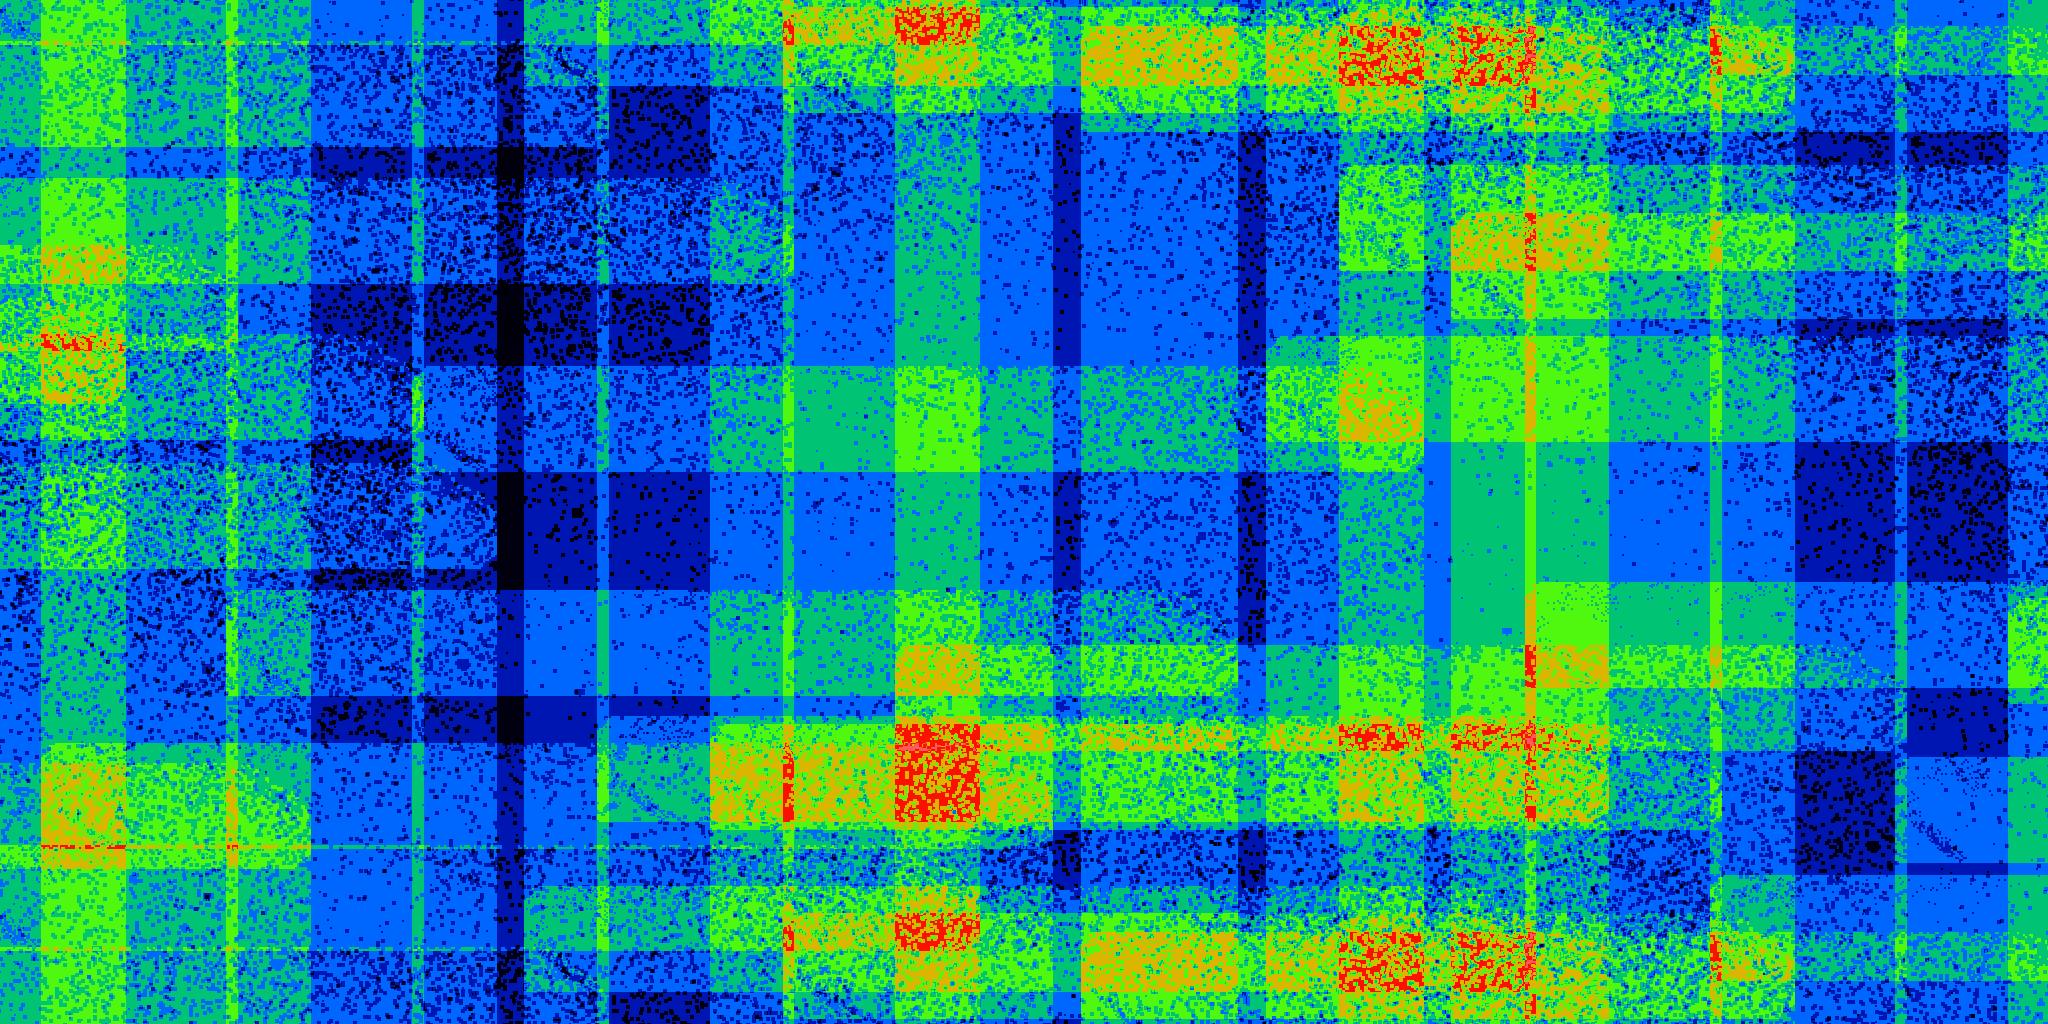
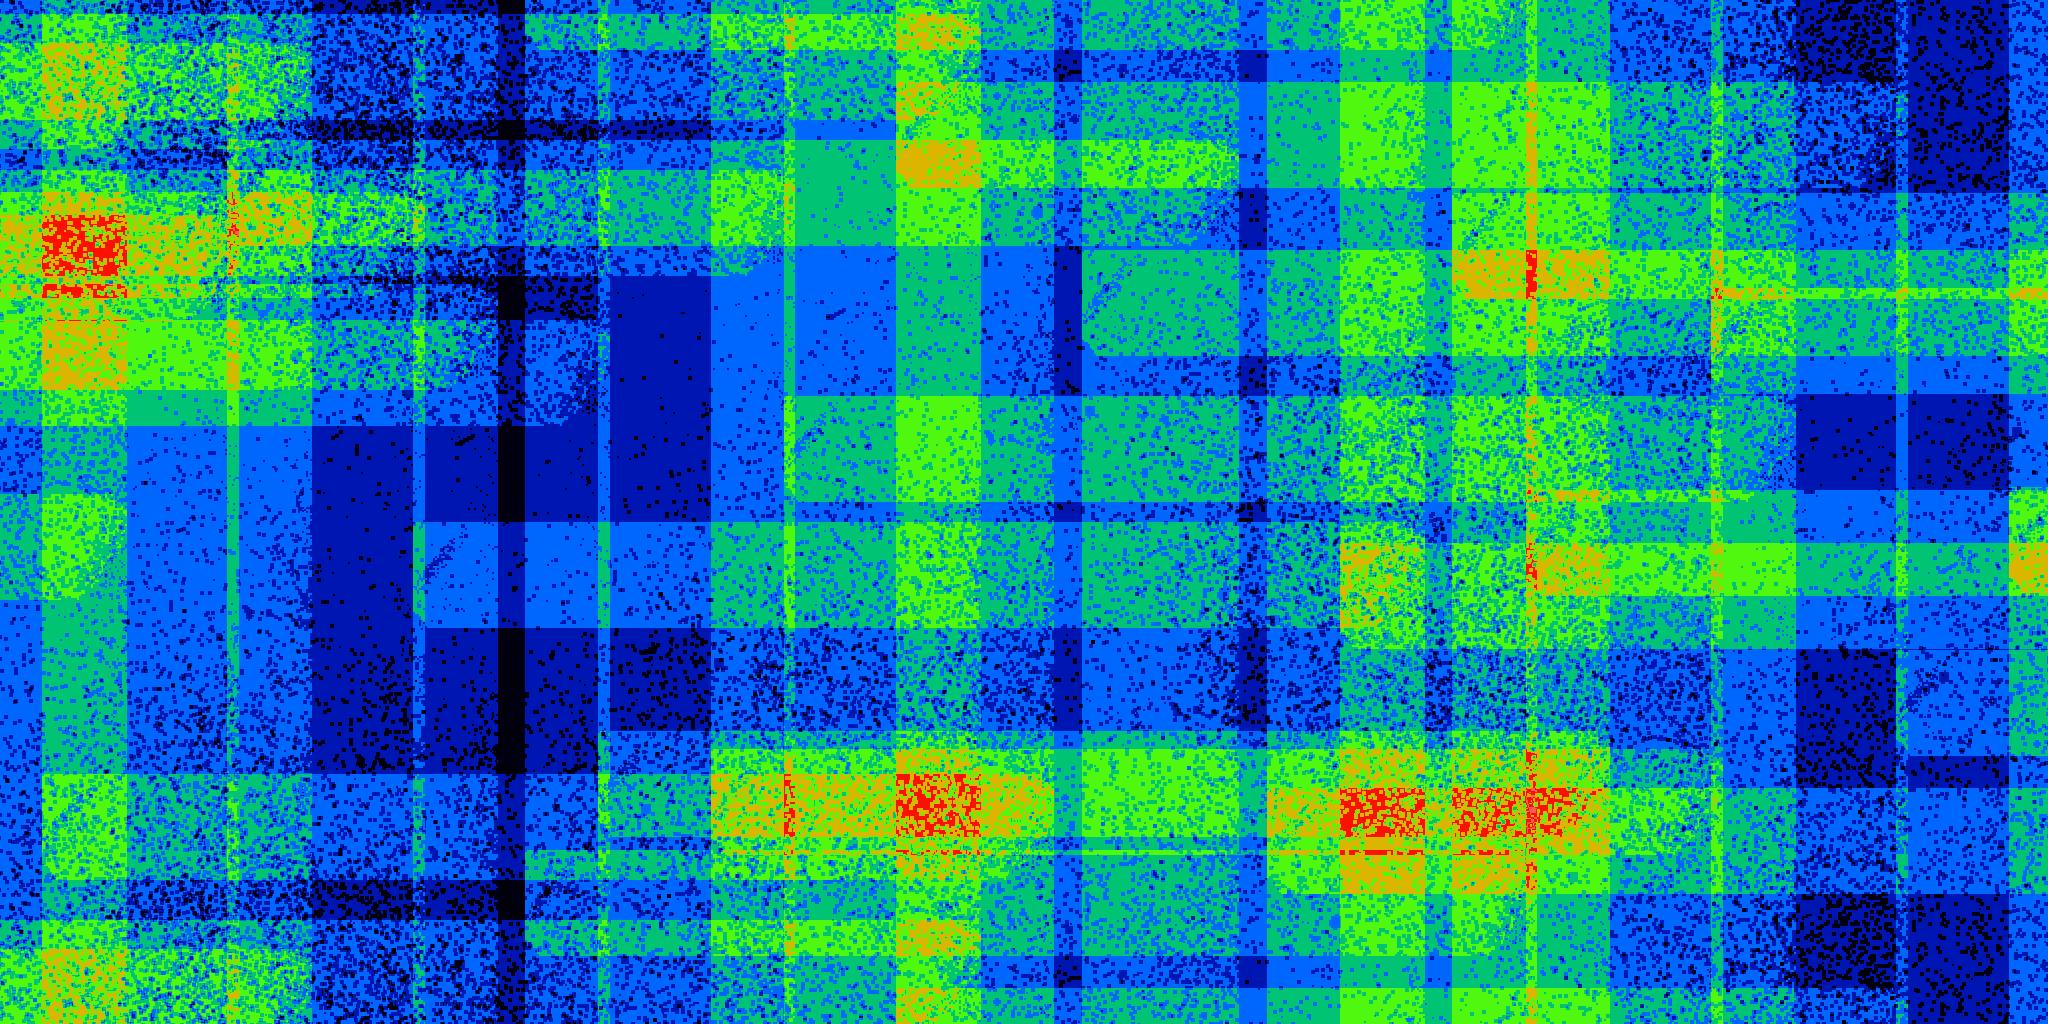
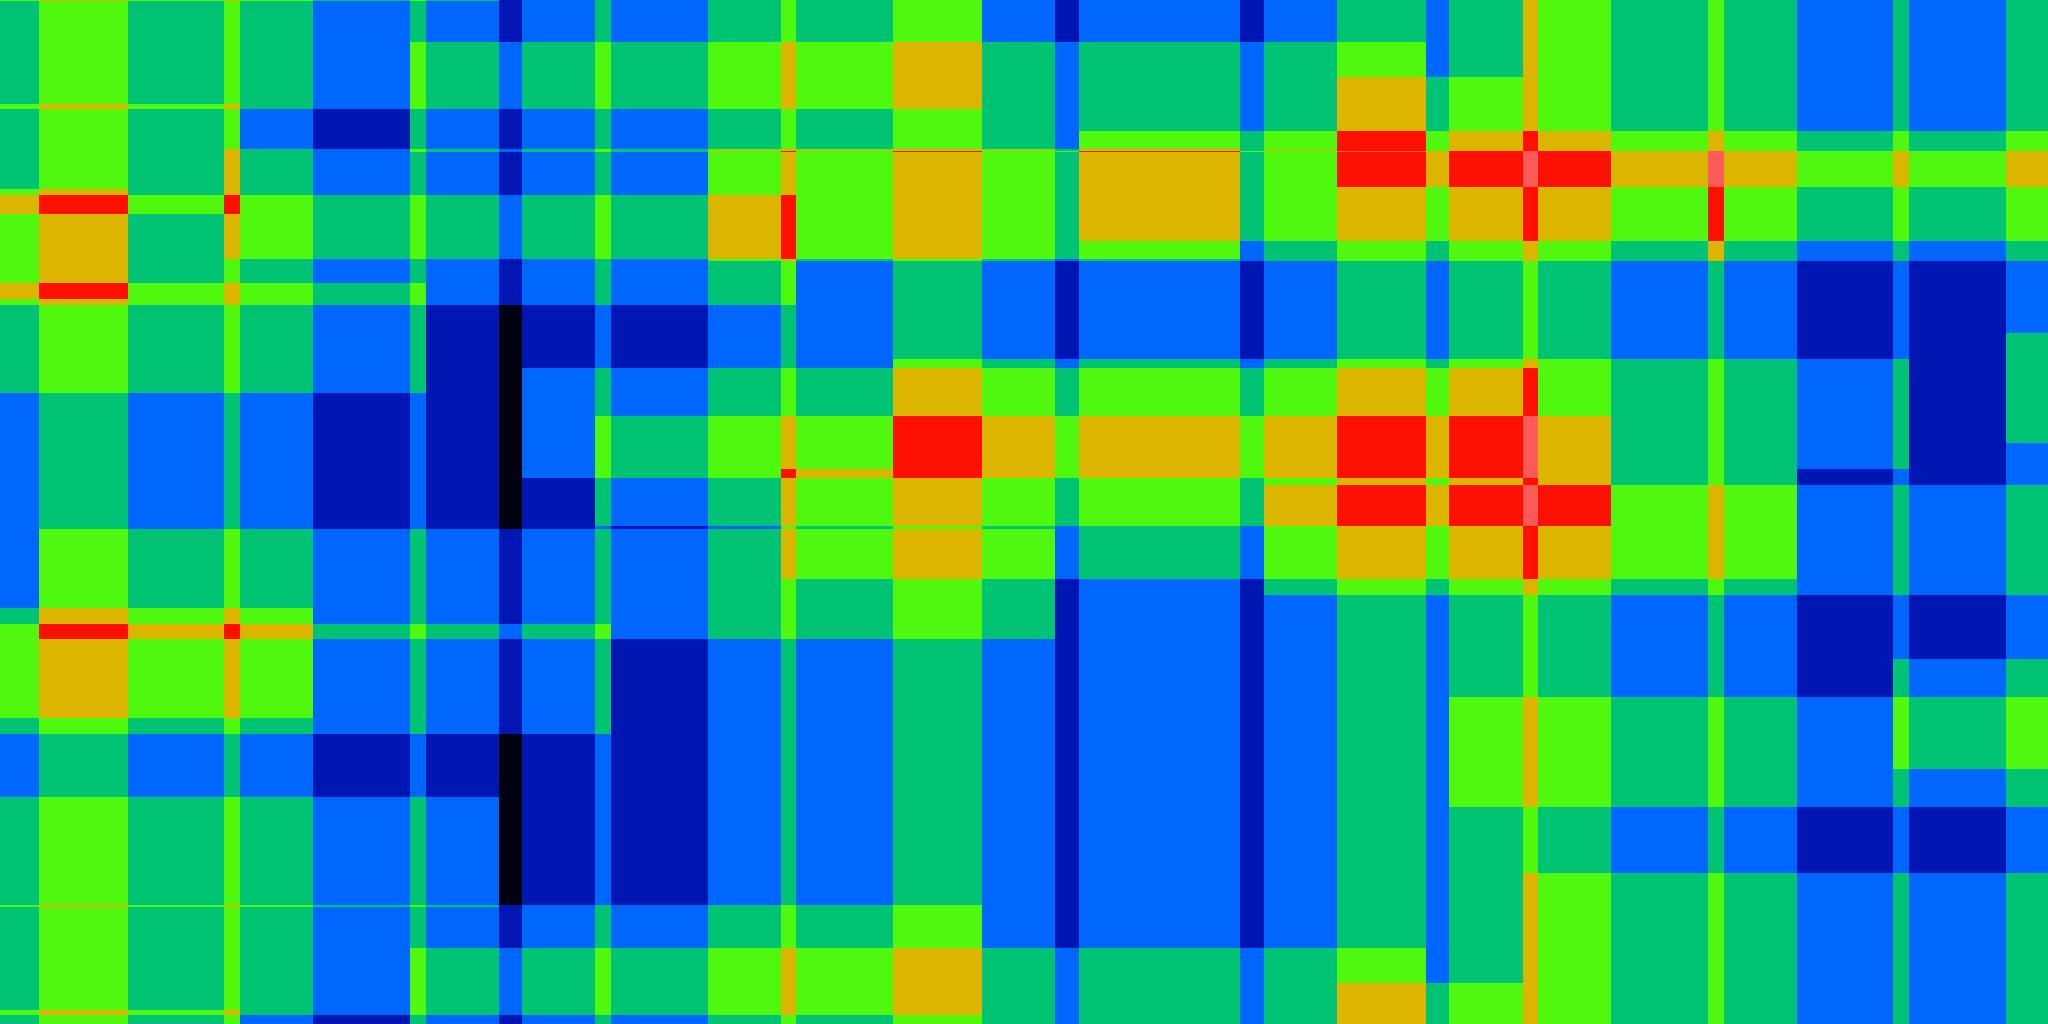
The JPEG representations of the coverage maps are shown in false color
with black denoting smallest coverage and white denoting greatest coverages.
For Test Run A, the color range corresponds to a minimum value of 55 sec
(6.9 coverages) and a maximum of 112 (14 exposures). For Test Run B,
the minimum display value is 6.9 and maximum is 14, and
8-deep coverage areas are indicated in dark blue. For Test Run C,
the display range is 5.9 to 14, and 8-deep coverage areas are indicated
in blue.
| Test Run | Test No. | Device | Mask Name1 | Rotation (deg) | In-scan step (arcmin) | Cross-scan step (arcmin) | Frame Phase2 | Dropped Orbit3 | FITS map4 |
|---|---|---|---|---|---|---|---|---|---|
| A | 1 | Si:As FPA25 | fpa25_more_bad_pix_tot.fits | 0 | 42.3 | 4.7 | 17% | 0 | X |
| 2 | Si:As FPA25 | fpa25_more_bad_pix_tot.fits | 90 | 42.3 | 4.7 | 17% | 0 | X | |
| 3 | Si:As FPA25 | fpa25_more_bad_pix_tot.fits | 0 | 42.3 | 4.7 | 17% | 1/8 | X | |
| 4 | Si:As FPA25 | fpa25_more_bad_pix_tot.fits | 90 | 42.3 | 4.7 | 17% | 1/8 | X | |
| 5 | Si:As FPA29 | fpa29_more_bad_pix_tot.fits | 0 | 42.3 | 4.7 | 17% | 0 | X | |
| 6 | Si:As FPA29 | fpa29_more_bad_pix_tot.fits | 90 | 42.3 | 4.7 | 17% | 0 | X | |
| 7 | Si:As FPA29 | fpa29_more_bad_pix_tot.fits | 0 | 42.3 | 4.7 | 17% | 1/8 | X | |
| 8 | Si:As FPA29 | fpa29_more_bad_pix_tot.fits | 90 | 42.3 | 4.7 | 17% | 1/8 | X | |
| B | 1 | Si:As FPA31 | bad_pix_tot31.fits | 0 | 41.538 | 4.69 | random | 0 | X |
| 2 | Si:As FPA31 | bad_pix_tot31.fits | 90 | 41.538 | 4.69 | random | 0 | X | |
| 3 | Si:As FPA31 | bad_pix_tot31.fits | 0 | 41.538 | 4.69 | random | 1/8 | X | |
| 4 | Si:As FPA31 | bad_pix_tot31.fits | 90 | 41.538 | 4.69 | random | 1/8 | X | |
| 5 | Si:As FPA31 | bad_pix_tot31.fits | 0 | 41.538 | 5.87 | random | 0 | X | |
| 6 | Si:As FPA31 | bad_pix_tot31.fits | 90 | 41.538 | 5.87 | random | 0 | X | |
| C | 1 | Si:As FPA25 | more_bad_pix_tot25.fits | 0 | 41.538 | +30.65, -22.15 | random | 4/15 | X |
| 2 | Si:As FPA25 | more_bad_pix_tot25.fits | 90 | 41.538 | +30.65, -22.15 | random | 4/15 | X | |
| 3 | Si:As FPA29 | more_bad_pix_tot29.fits | 0 | 41.538 | +30.65, -22.15 | random | 4/15 | X | |
| 4 | Si:As FPA29 | more_bad_pix_tot29.fits | 90 | 41.538 | +30.65, -22.15 | random | 4/15 | X | |
| 5 | Si:As FPA31 | more_bad_pix_tot31.fits | 0 | 41.538 | +30.65, -22.15 | random | 4/15 | X | |
| 6 | Si:As FPA31 | more_bad_pix_tot31.fits | 90 | 41.538 | +30.65, -22.15 | random | 4/15 | X | |
| 7 | Si:As - | no bad pixels | - | 41.538 | +30.65, -22.15 | random | 4/15 | X |
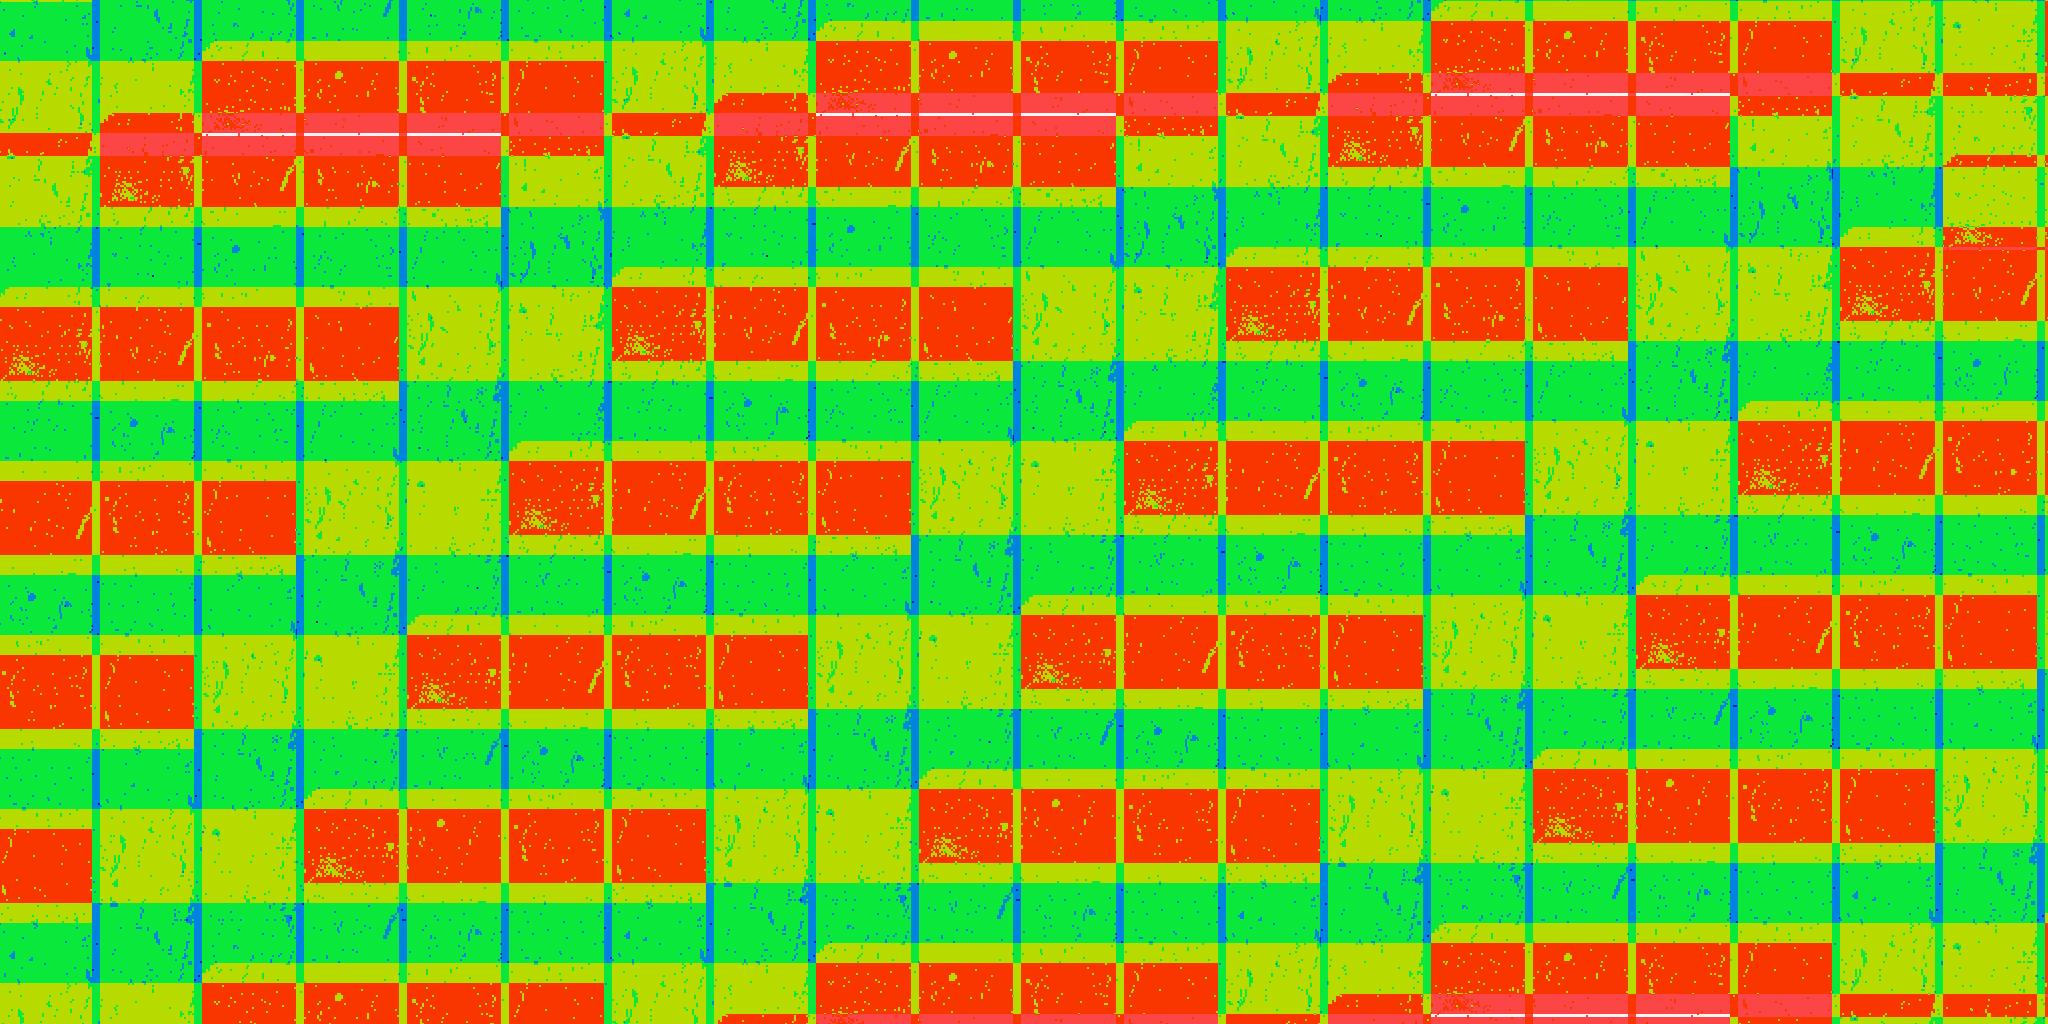
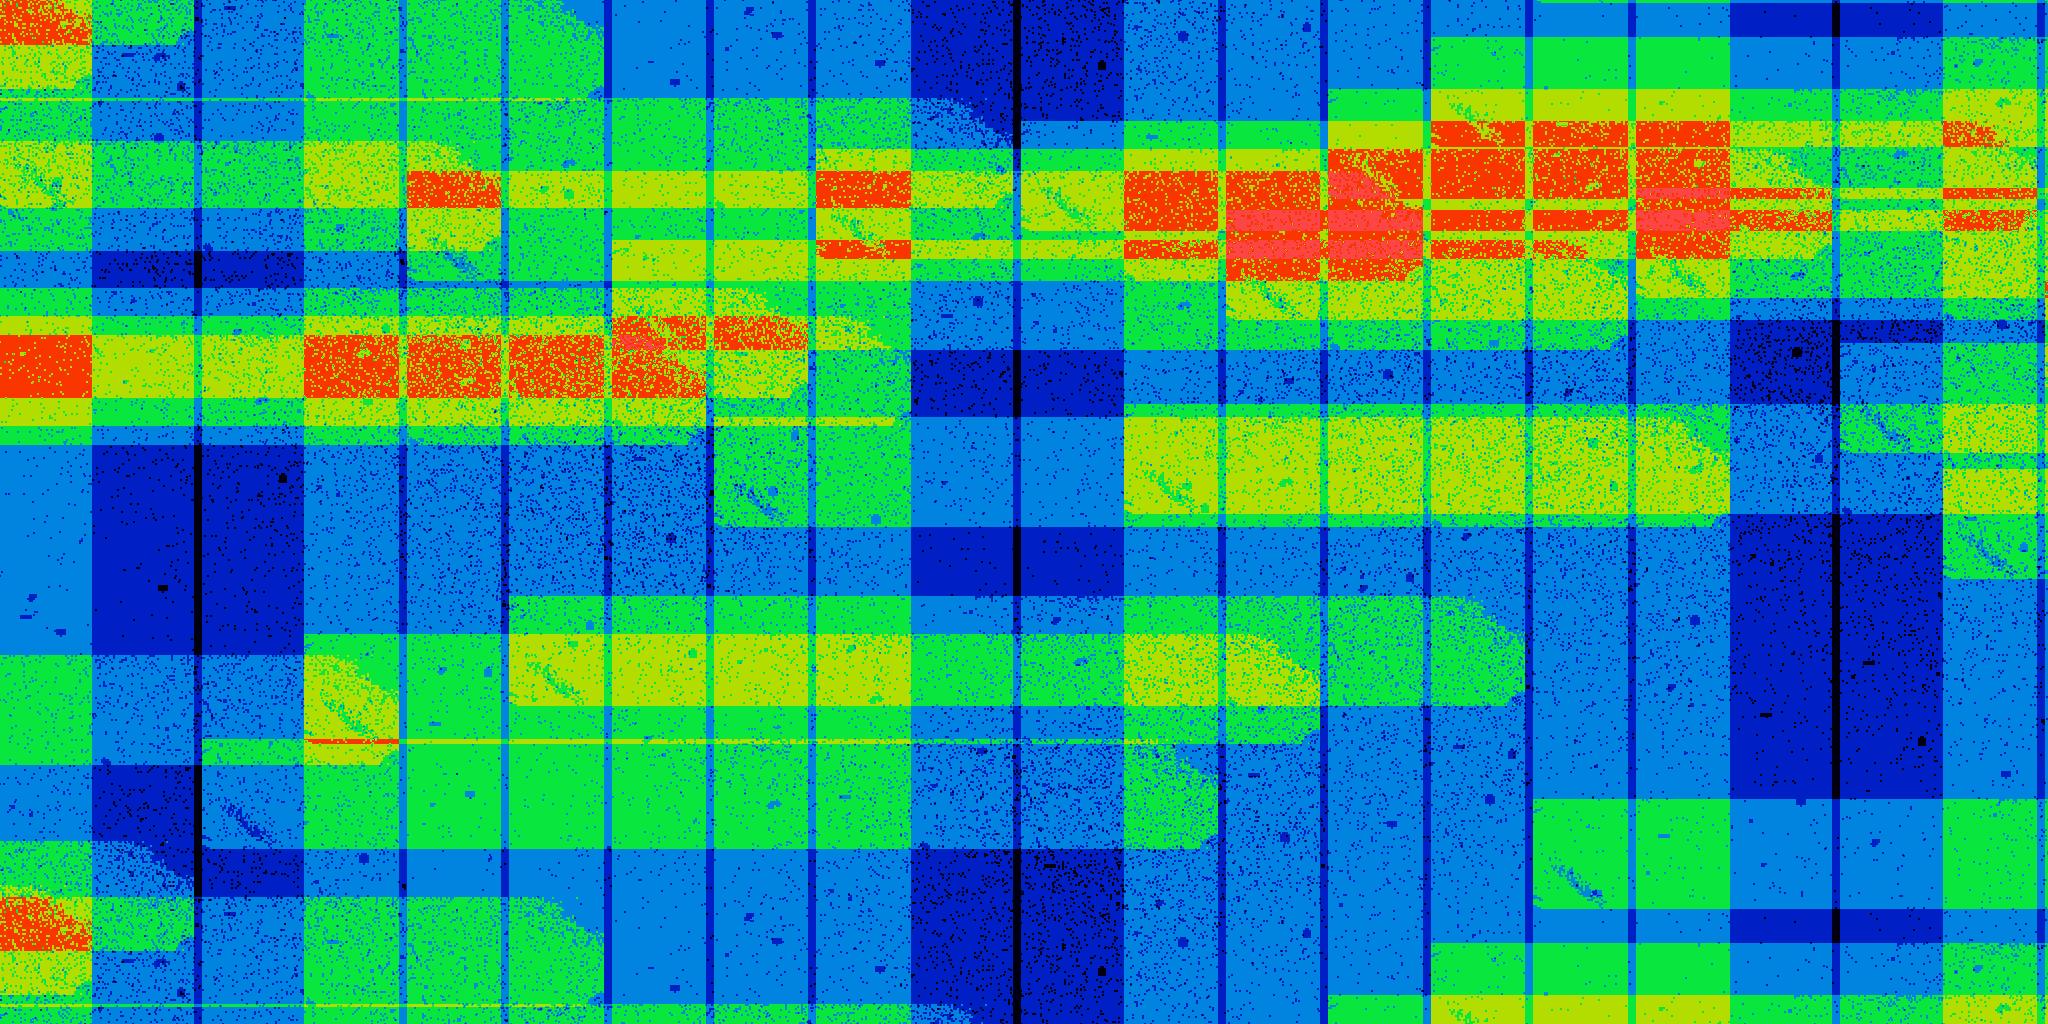
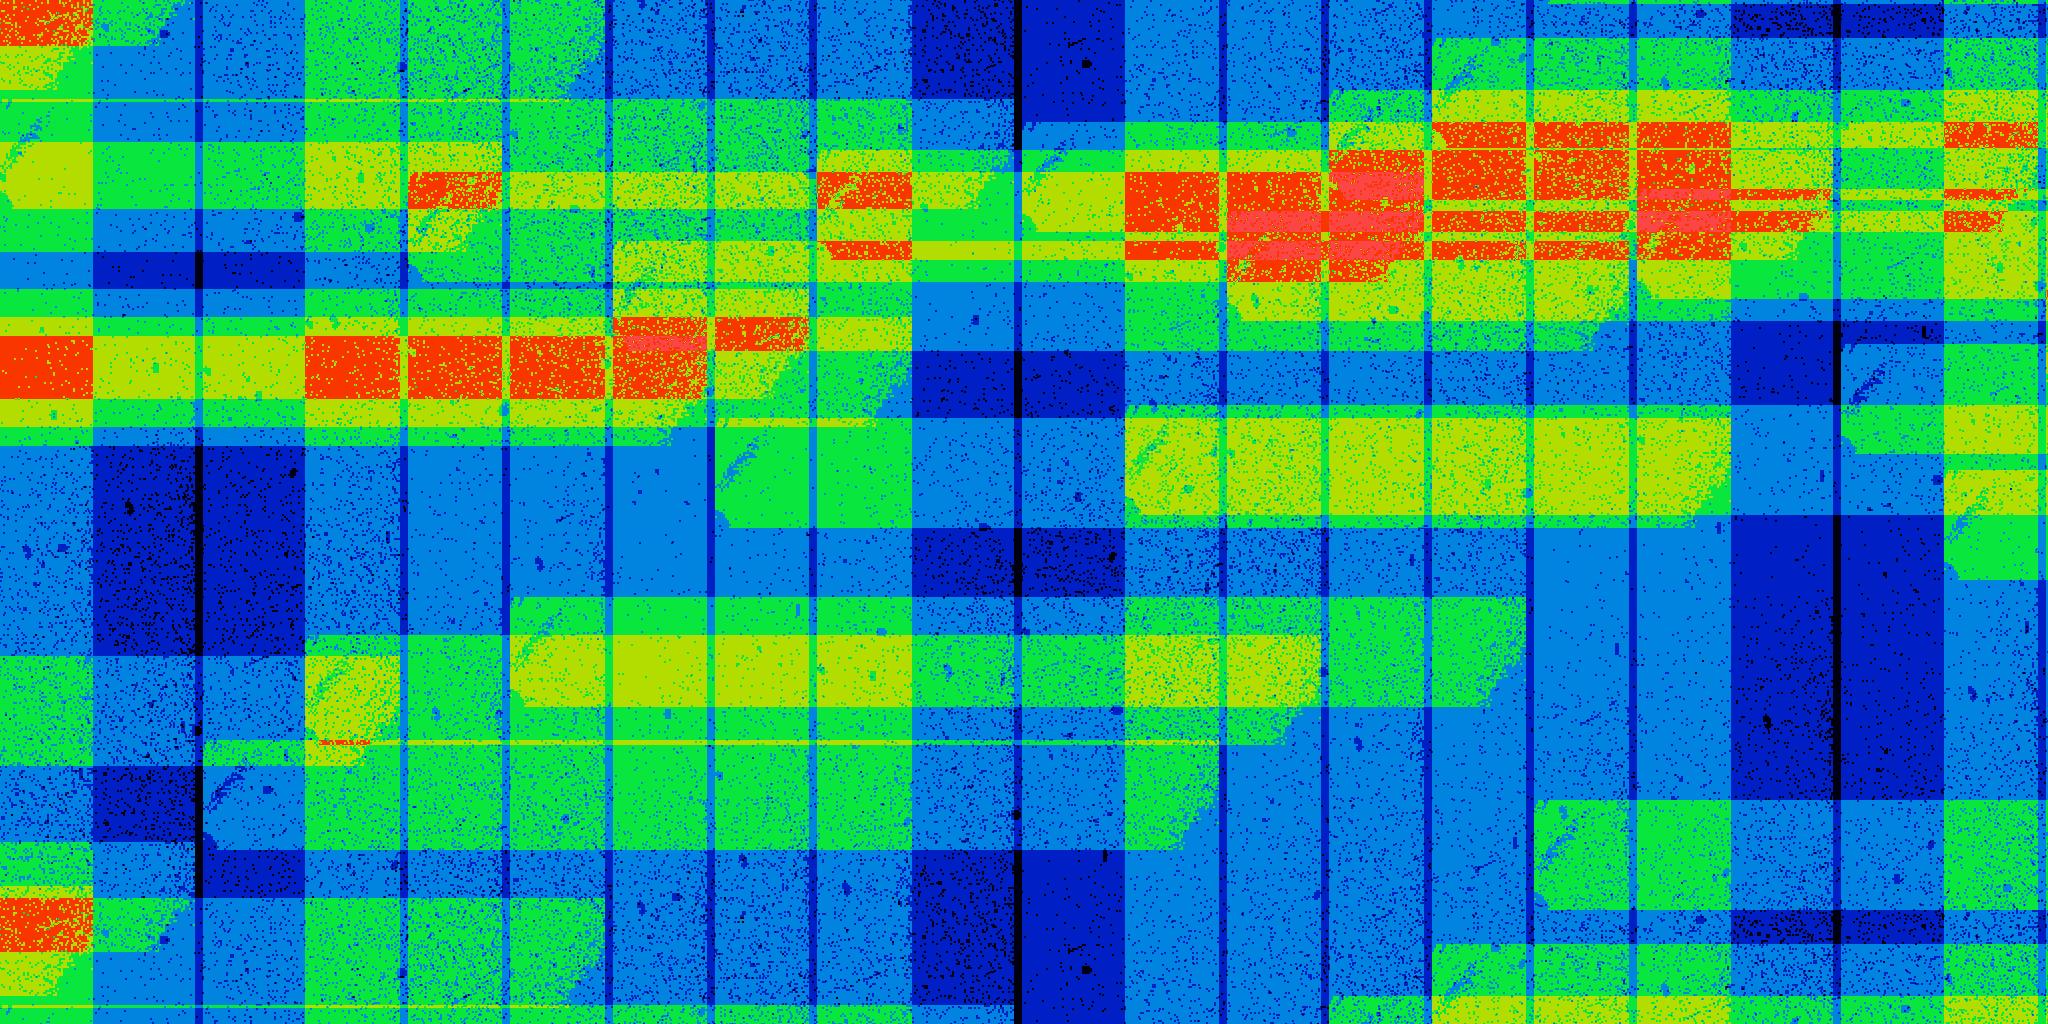
Summary Software proof-of-concept run. Comparison of FPA25 and FPA29 Si:As devices. Fixed orbit frame phasing (unrealistic). <1% of pixels have <8 coverages if no orbits lost. <1% (FPA25) and 3.2-3.3% (FPA29) have <8 coverages if 1/8 orbits dropped.
Coverage histogram for fpa25_more_bad_pix_tot_cov.fits:
Depth (secs) =  56.00  64.00  72.00  80.00  88.00  96.00 104.00 112.00
Frac         = 0.0000 0.0005 0.0383 0.3366 0.3227 0.2720 0.0283 0.0016
Coverage histogram for fpa25_more_bad_pix_tot_cov_90.fits:
Depth (secs) =  56.00  64.00  72.00  80.00  88.00  96.00 104.00 112.00
Frac         = 0.0000 0.0004 0.0361 0.3406 0.3225 0.2717 0.0271 0.0015
Coverage histogram for fpa25_more_bad_pix_tot_cov_8.fits:
Depth (secs) =  48.00  56.00  64.00  72.00  80.00  88.00  96.00 104.00
Frac         = 0.0001 0.0076 0.1412 0.3775 0.2880 0.1716 0.0133 0.0008
Coverage histogram for fpa25_more_bad_pix_tot_cov_8_90.fits:
Depth (secs) =  40.00  48.00  56.00  64.00  72.00  80.00  88.00  96.00 104.00
Frac         = 0.0000 0.0001 0.0071 0.1409 0.3797 0.2883 0.1703  0.0128 0.0007
Coverage histogram for fpa29_more_bad_pix_tot_cov.fits:
Depth (secs) =  48.00  56.00  64.00  72.00  80.00  88.00  96.00 104.00 112.00
Frac         = 0.0000 0.0005 0.0108 0.1003 0.3456 0.3315 0.1915 0.0190 0.0008
Coverage histogram for fpa29_more_bad_pix_tot_cov_90.fits:
Depth (secs) =  40.00  48.00  56.00  64.00  72.00  80.00  88.00  96.00 104.00 112.00
Frac         = 0.0000 0.0000 0.0009 0.0126 0.1026 0.3454 0.3202 0.1978 0.0195 0.0009
Coverage histogram for fpa29_more_bad_pix_tot_cov_8.fits:
Depth (secs) =  32.00  40.00  48.00  56.00  64.00  72.00  80.00  88.00  96.00 104.00
Frac         = 0.0000 0.0000 0.0015 0.0298 0.1923 0.3735 0.2724 0.1208 0.0092 0.0004
Coverage histogram for fpa29_more_bad_pix_tot_cov_8_90.fits:
Depth (secs) =  32.00  40.00  48.00  56.00  64.00  72.00  80.00  88.00  96.00 104.00
Frac         = 0.0000 0.0001 0.0021 0.0311 0.1933 0.3716 0.2672 0.1251 0.0089 0.0005
 |
 |
 |
 |
| Figure 1 - Test A.1 FPA25 | Figure 2 - Test A.2 FPA25 | Figure 3 - Test A.3 FPA25 | Figure 4 - Test A.4 FPA25 |
 |
 |
 |
 |
| Figure 5 - Test A.5 FPA29 | Figure 6 - Test A.6 FPA29 | Figure 7 - Test A.7 FPA29 | Figure 8 - Test A.8 FPA29 |
| False-color 2048x1024 JPEG images of coverage maps produced in Test Run A. Color indicates exposure time (number of coverages). Color range is 55 sec to 112 sec in all images. Black regions have 55 sec or less exposure and white regions have 112 sec or greater exposure. 64 sec exposure (8 coverages) is indicated in dark blue. Click on the thumbnails to see full-size JPEG maps. | |||
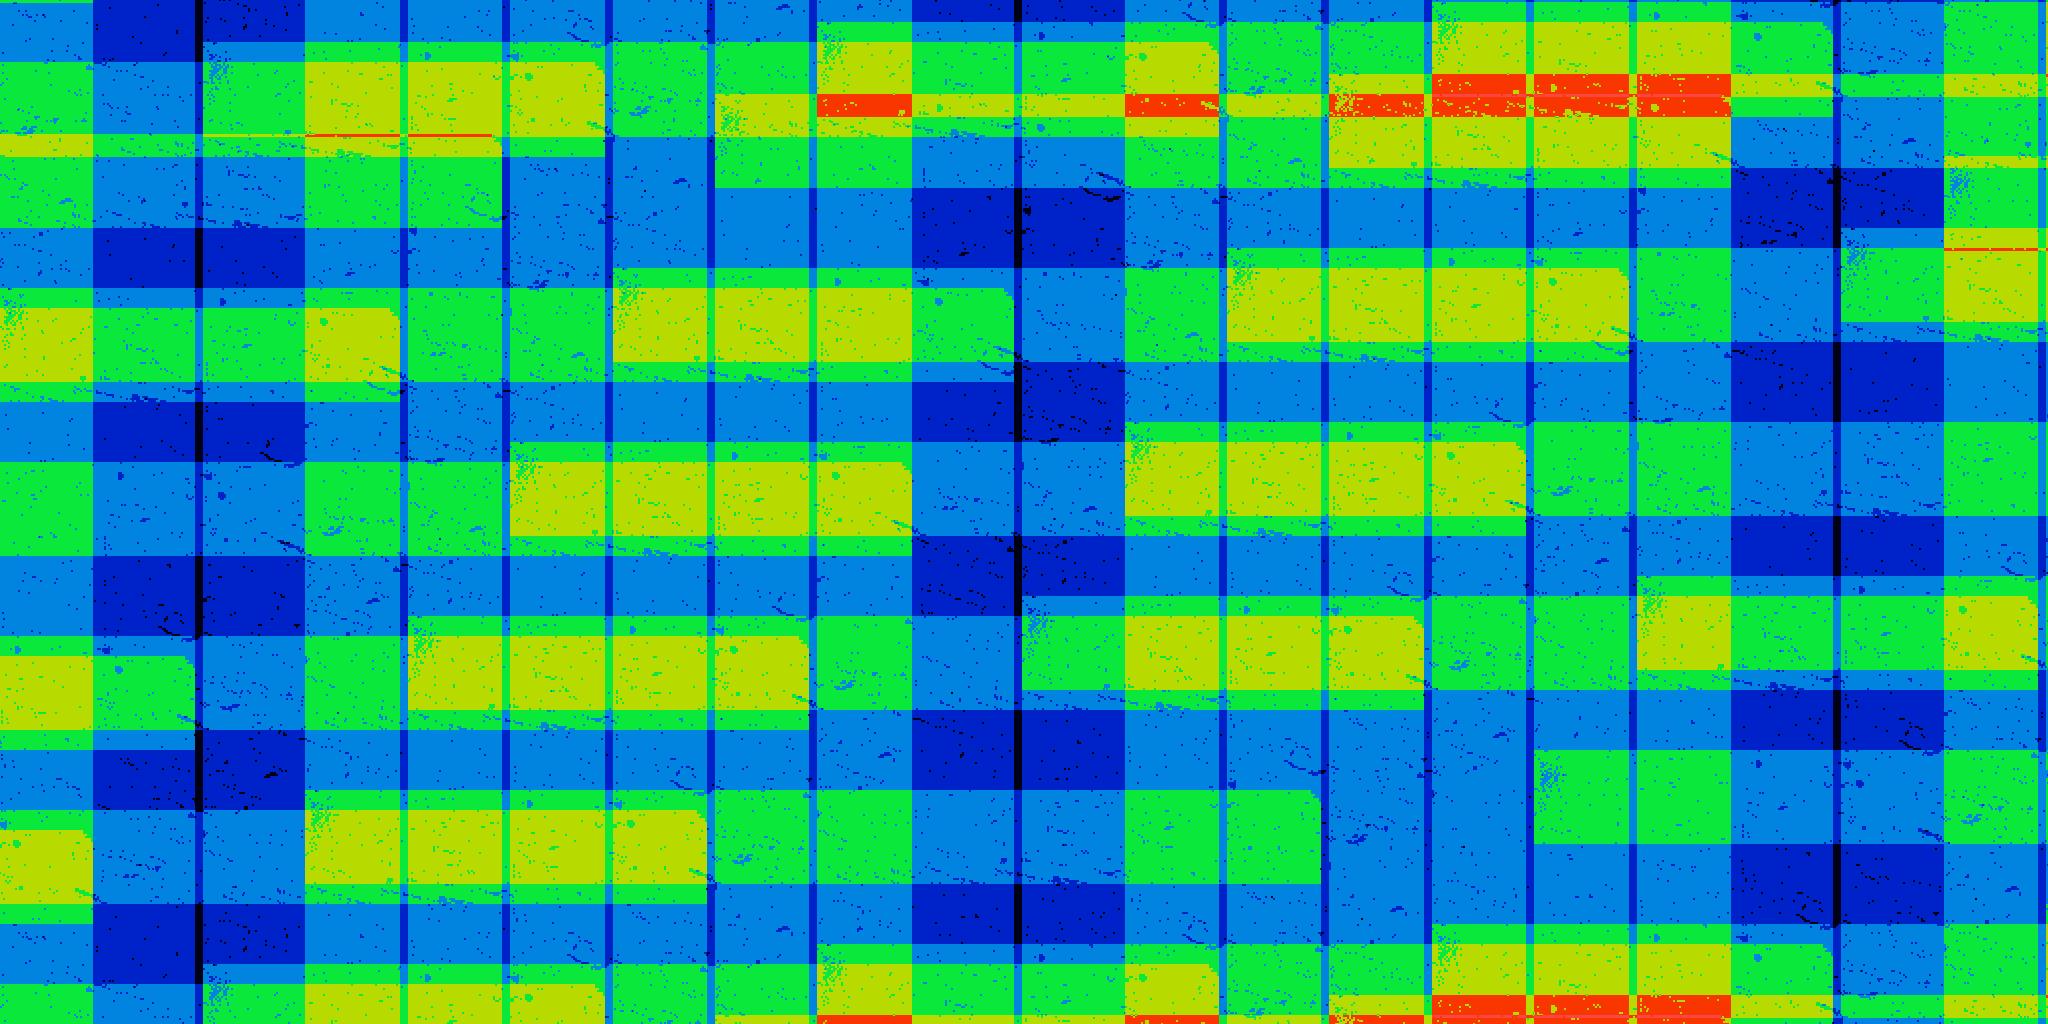
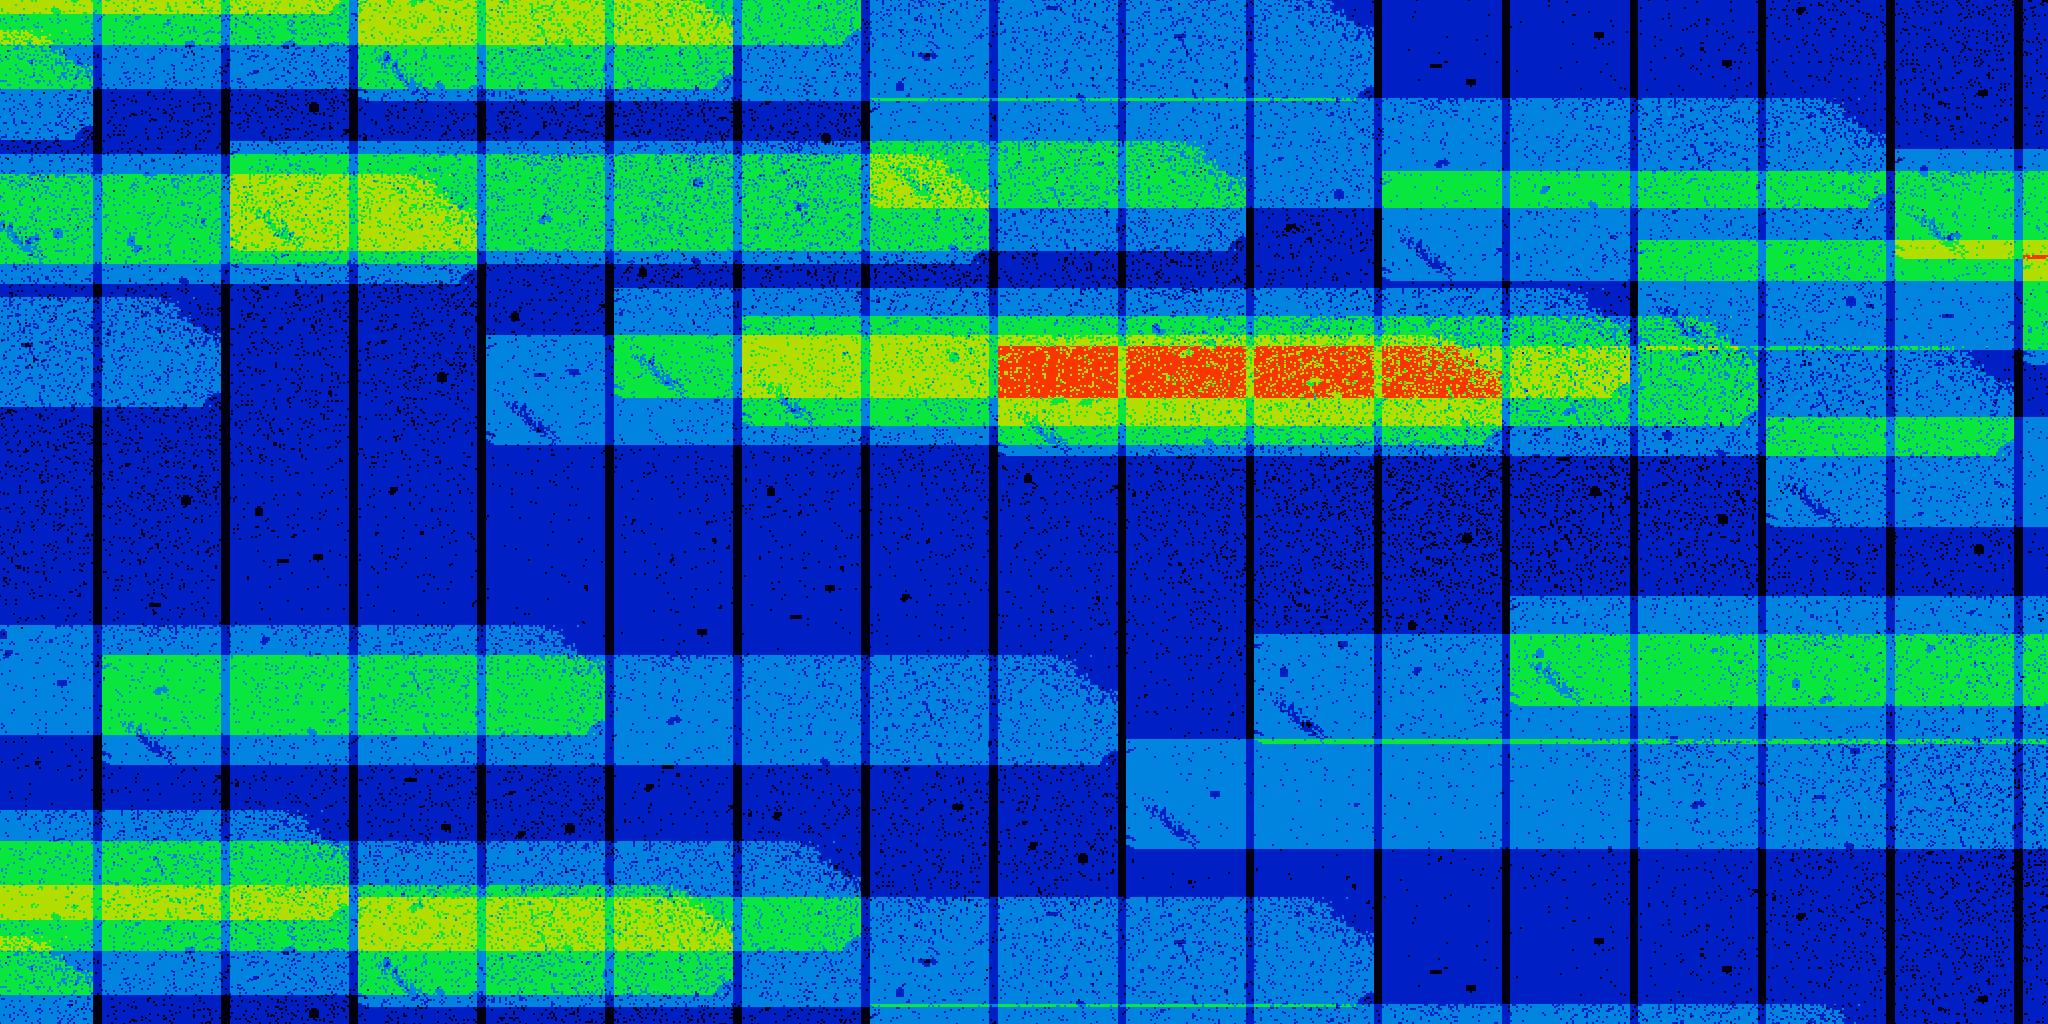
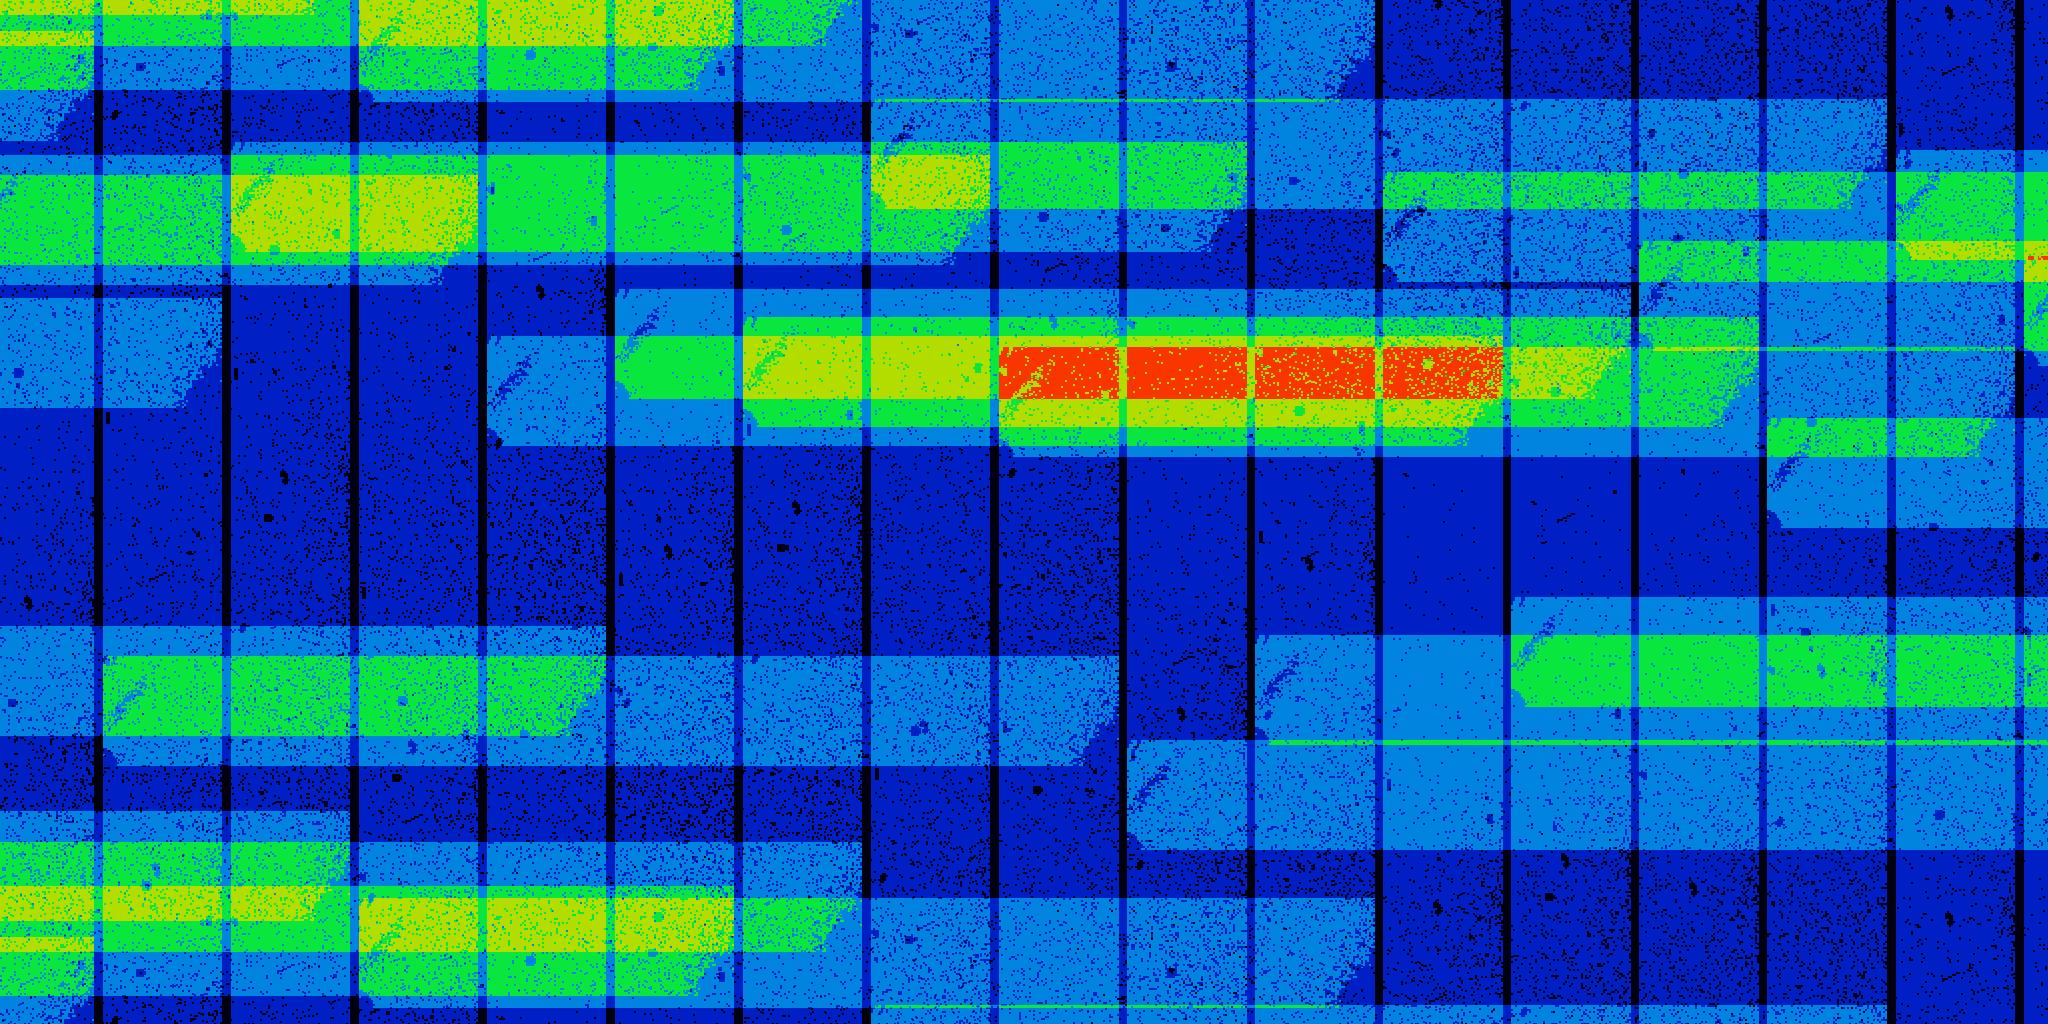
Summary Si:As FPA31 device. Random orbit-orbit frame phasing which should be more realistic. More precise value used for in-scan stepping (41.538 arcmin) based on 5720 sec orbital period and 11 sec duty cycle. Cross-stepping for runs B.1-B.4 analogous to Test Run A: Constant cross-scan step of 10% of FOV (4.69 arcmin). Runs B.3 and B.4 drop one out of 8 orbits. Cross-stepping for runs B.5 and B.6 represent extreme case in which cross-stepping is large enough to give only an average of 8 deep coverages (5.87 arcmin).
For 10% FOV cross-stepping, <1% of pixels have fewer than 8 coverages if no orbits are dropped. Approximately 1.5% of pixels have fewer than 8 coverages with one orbit in 8 is missed. For 12.5% FOV cross-stepping, 5.7-6.5% of pixels will have fewer than 8 coverages depending on the array orientation.
Coverage histogram for fpa31_bad_pix_tot31_cov.fits:
Depth (num) =   6.00   7.00   8.00   9.00  10.00  11.00  12.00  13.00  14.00  15.00
Frac        = 0.0000 0.0001 0.0032 0.0571 0.3521 0.3179 0.1653 0.0824 0.0215 0.0006
Coverage histogram for fpa31_bad_pix_tot31_cov_90.fits:
Depth (num) =   7.00   8.00   9.00  10.00  11.00  12.00  13.00  14.00  15.00
Frac        = 0.0001 0.0034 0.0648 0.3531 0.3083 0.1632 0.0824 0.0241 0.0006
Coverage histogram for fpa31_bad_pix_tot31_cov.fits:
Depth (num) =   5.00   6.00   7.00   8.00   9.00  10.00  11.00  12.00  13.00
Frac        = 0.0000 0.0006 0.0146 0.1572 0.3668 0.2762 0.1375 0.0426 0.0046
Coverage histogram for fpa31_bad_pix_tot31_cov_90.fits:
Depth (num) =   5.00   6.00   7.00   8.00   9.00  10.00  11.00  12.00  13.00
Frac        = 0.0000 0.0005 0.0159 0.1595 0.3713 0.2654 0.1379 0.0446 0.0050
Coverage histogram for fpa31_bad_pix_tot31_cov_5.87.fits:
Depth (num) =   5.00   6.00   7.00   8.00   9.00  10.00  11.00  12.00
Frac        = 0.0001 0.0023 0.0548 0.3925 0.3352 0.1593 0.0469 0.0089
Coverage histogram for fpa31_bad_pix_tot31_cov_5.87_90.fits:
Depth (num) =   5.00   6.00   7.00   8.00   9.00  10.00  11.00  12.00
Frac        = 0.0001 0.0028 0.0618 0.3870 0.3310 0.1568 0.0501 0.0103
 |
 |
| Figure 9 - Test B.1 FPA31 | Figure 10 - Test B.2 FPA31 |
 |
 |
| Figure 11 - Test B.3 FPA31 | Figure 12 - Test B.4 FPA31 |
 |
 |
| Figure 13 - Test B.5 FPA31 | Figure 14 - Test B.6 FPA31 |
| False-color 2048x1024 JPEG images of coverage maps produced in Test Run B. Color indicates depth-of-coverage. Color range is 6.9 to 14 in all images. Black regions have 7 or fewer coverages and white regions have 14 or more coverages. 8 coverages is indicated in dark blue. Click on the thumbnails to see full-size JPEG maps. | |
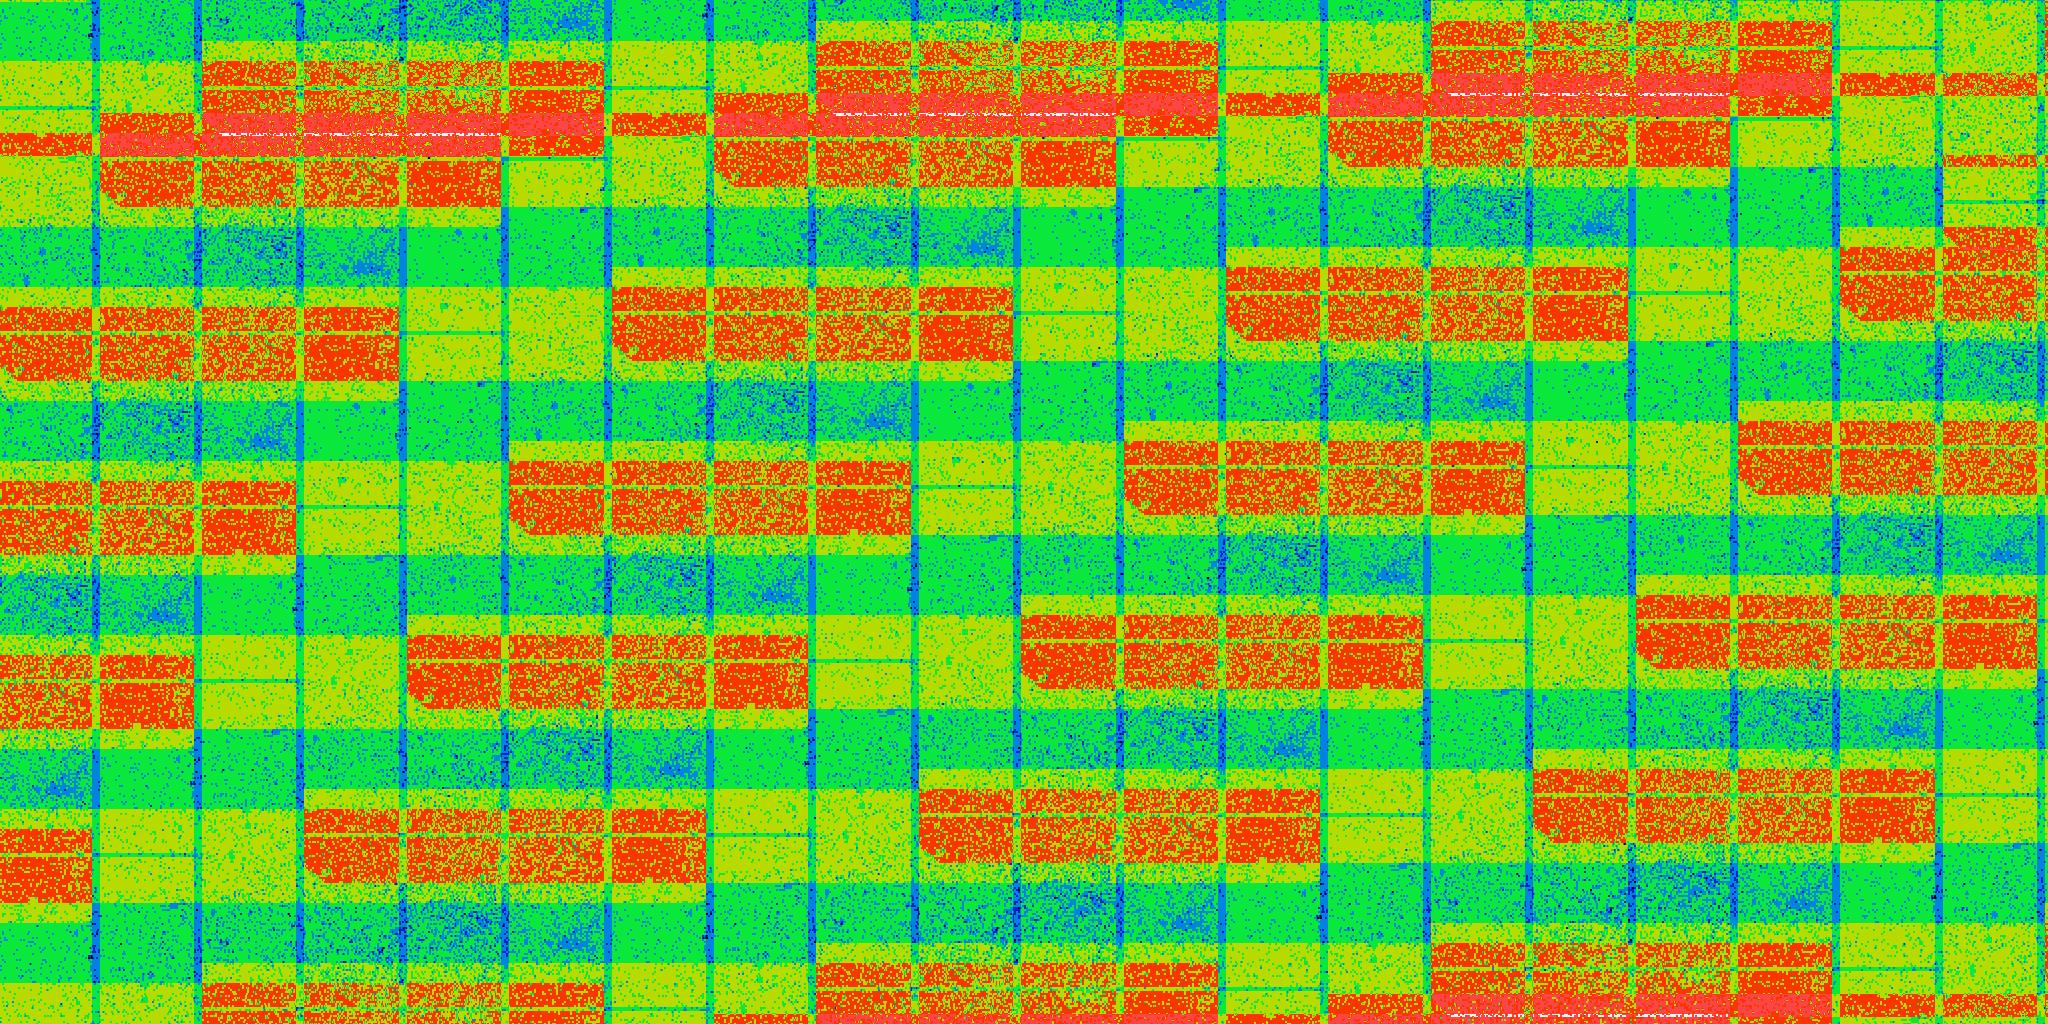
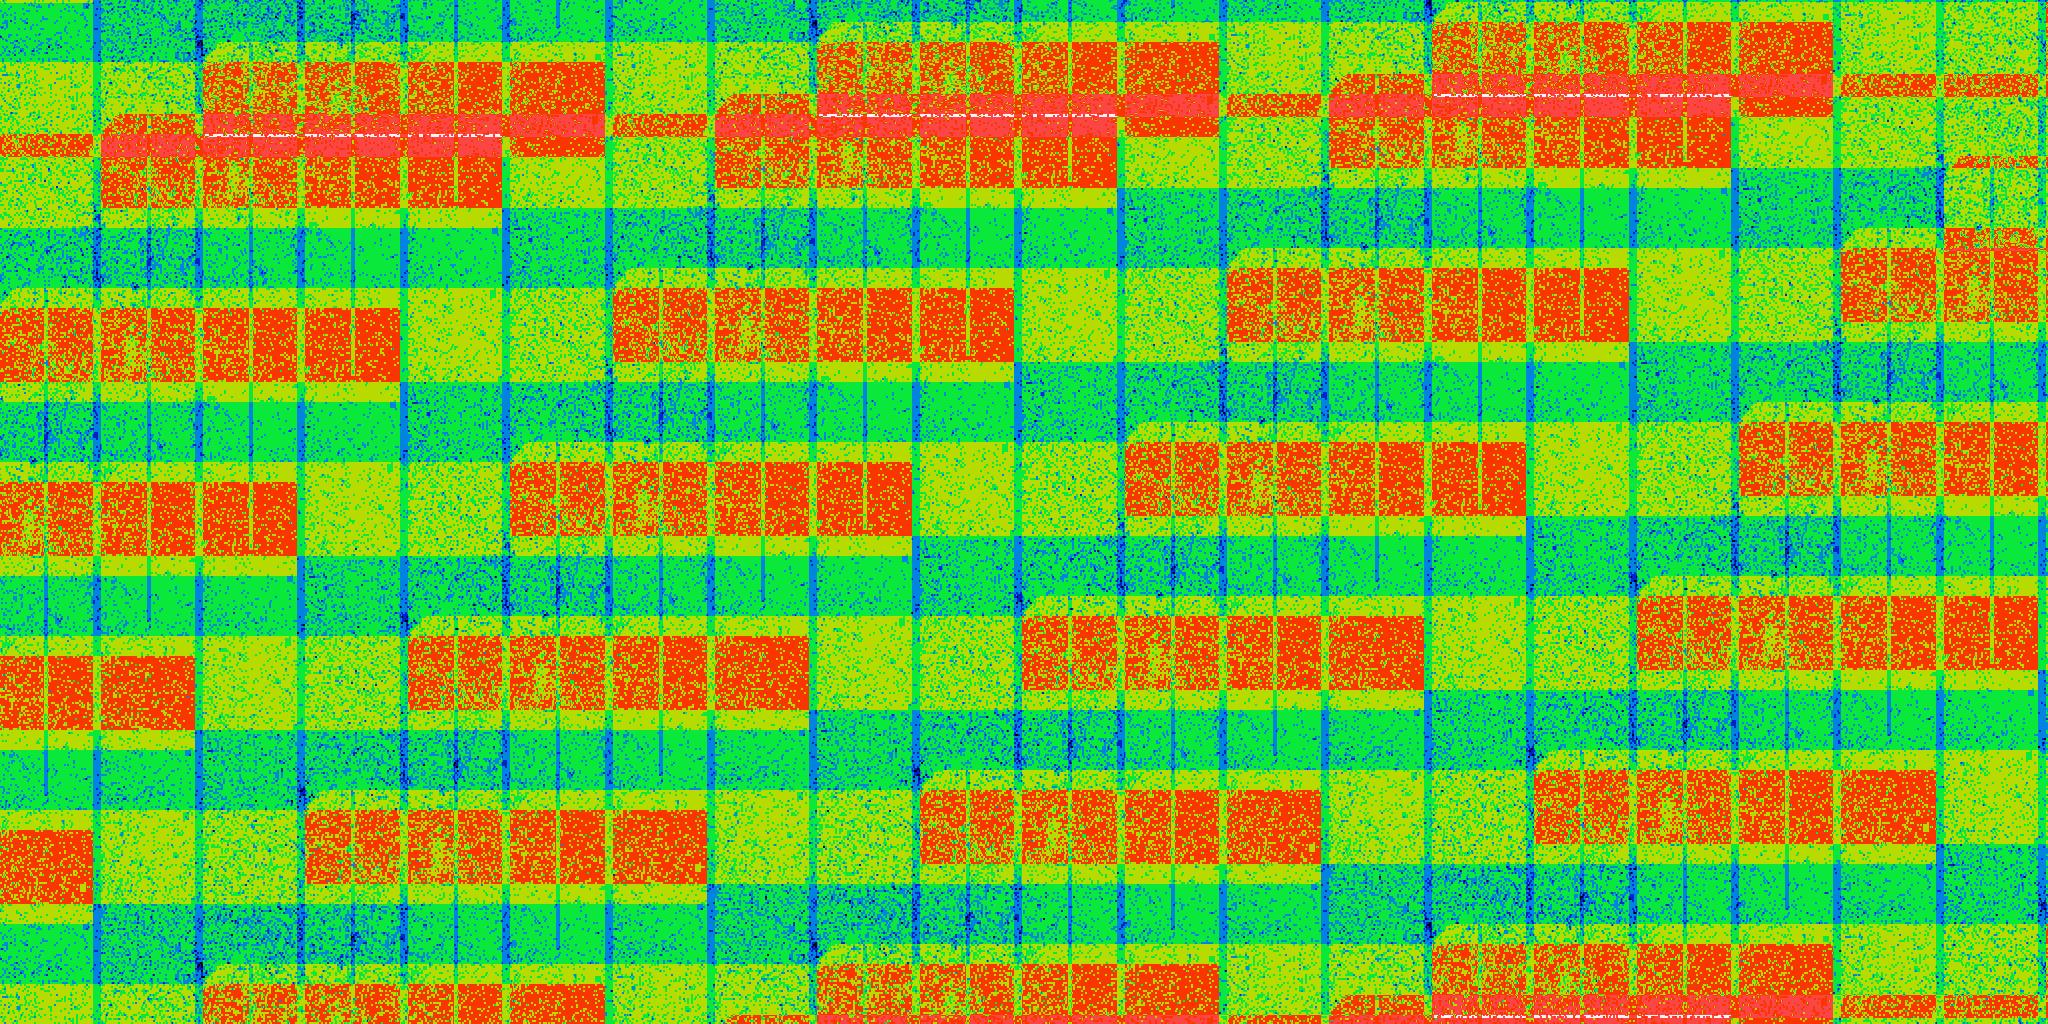
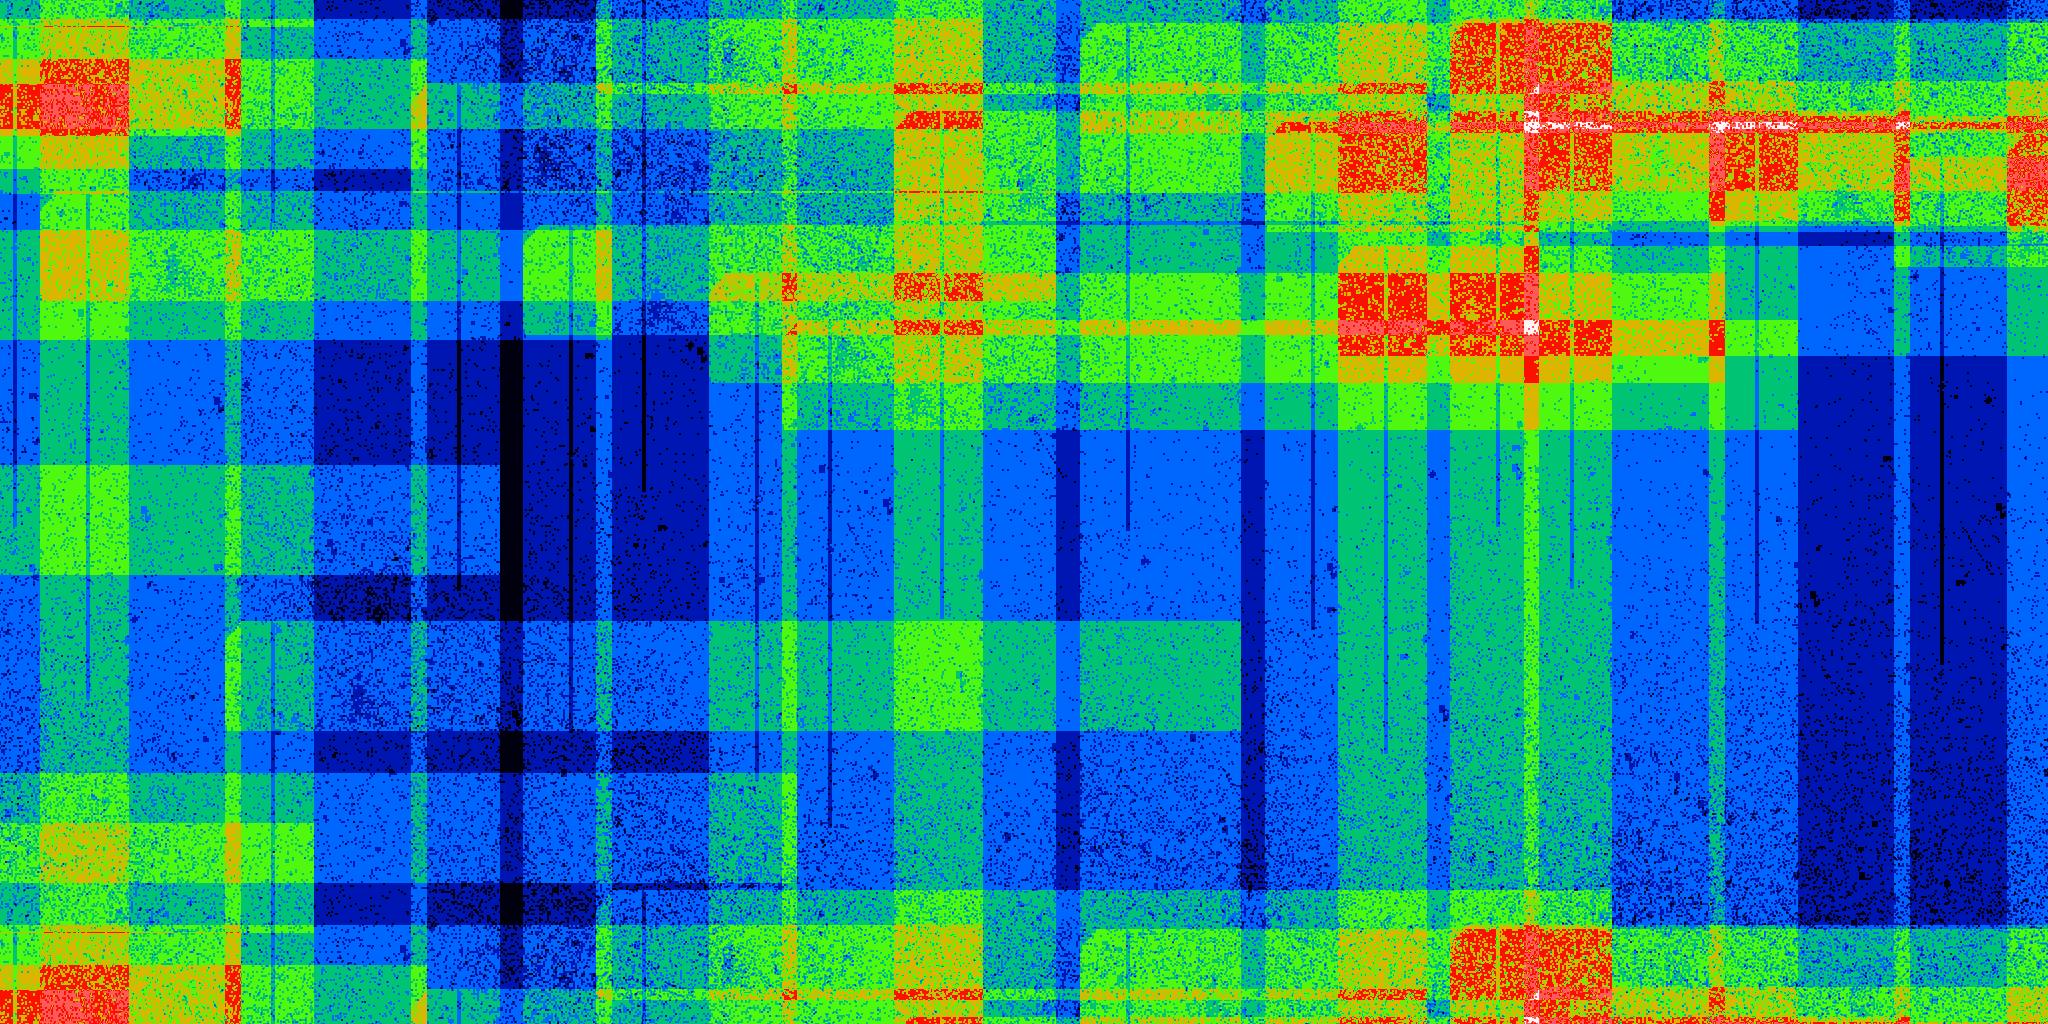
Summary Si:As FPA25, FPA29 and FPA31 devices. Random orbit-orbit frame phasing. In-scan step size 41.538 arcmin (based on 5720 sec orbital period and 11 sec duty cycle). Cross-stepping simulates actual mission design: +30.65 arcmin followed by -22.15 arcmin. Sawtooth longitude stepping. After 15 orbits, this gives an average cross-scan step of 4.25 arcmin, which is slightly faster than the precession rate. Data loss due to SAA avoidance is simulated by dropping four consecutive orbits out of each 15.
Approximately 10%-14% of pixels have fewer than 8 coverages with FPA 25. 18%-20% of the area has fewer than 8 coverages with FPA29. With FPA31, 19%-22% of the area has fewer than 8 coverages.
For reference, a test of a hypothetical "perfect" Si:As detector with no bad pixels was run with the same scanning pattern. The test includes the 4 pixel wide "reference pixel" border as the other arrays, but no masked pixels. The results are shown in the entries for Test Run C.7 in the table below and in Figure 21. Even with no bad pixels, approximately 9.5% of the area receives fewer than 8 samples.
Coverage histogram for fpa25_more_bad_pix_tot_cov.fits:
Depth (num) =   4.00   5.00   6.00   7.00   8.00   9.00  10.00  11.00  12.00  13.00  14.00
Frac        = 0.0000 0.0001 0.0086 0.1289 0.2844 0.2908 0.1679 0.0882 0.0260 0.0048 0.0003
Coverage histogram for fpa25_more_bad_pix_tot_cov_90.fits:
Depth (num) =   5.00   6.00   7.00   8.00   9.00  10.00  11.00  12.00
Frac        = 0.0001 0.0063 0.0972 0.2579 0.3522 0.2083 0.0653 0.0128
Coverage histogram for fpa29_more_bad_pix_tot_cov.fits:
Depth (num) =   4.00   5.00   6.00   7.00   8.00   9.00  10.00  11.00  12.00  13.00  14.00  15.00
Frac        = 0.0000 0.0015 0.0243 0.1736 0.3024 0.2703 0.1505 0.0513 0.0171 0.0059 0.0028 0.0001
Coverage histogram for fpa29_more_bad_pix_tot_cov_90.fits:
Depth (num) =   3.00   4.00   5.00   6.00   7.00   8.00   9.00  10.00  11.00  12.00  13.00  14.00  15.00
Frac        = 0.0000 0.0000 0.0013 0.0210 0.1580 0.2916 0.2637 0.1539 0.0745 0.0287 0.0067 0.0005 0.0000
Coverage histogram for more_bad_pix_tot31_cov.fits:
Depth (num) =   3.00   4.00   5.00   6.00   7.00   8.00   9.00  10.00  11.00  12.00  13.00
Frac        = 0.0000 0.0001 0.0025 0.0305 0.1596 0.3376 0.2704 0.1391 0.0507 0.0092 0.0003
Coverage histogram for more_bad_pix_tot31_cov_90.fits:
Depth (num) =   3.00   4.00   5.00   6.00   7.00   8.00   9.00  10.00  11.00  12.00  13.00
Frac        = 0.0000 0.0001 0.0029 0.0345 0.1839 0.3139 0.2860 0.1353 0.0376 0.0057 0.0001
Coverage histogram for perfect-cov.fits:
Depth (num) =   6.00   7.00   8.00   9.00  10.00  11.00  12.00  13.00
Frac        = 0.0043 0.0922 0.3081 0.3129 0.1750 0.0845 0.0217 0.0013
 |
 |
| Figure 15 - Test C.1 FPA25 | Figure 16 - Test C.2 FPA25 |
 |
 |
| Figure 17 - Test C.3 FPA29 | Figure 18 - Test C.4 FPA29 |
 |
 |
| Figure 19 - Test C.5 FPA31 | Figure 20 - Test C.6 FPA31 |
 |
|
| Figure 21 - Test C.7 "Perfect" Array | |
| False-color 2048x1024 JPEG images of coverage maps produced in Test Run C. Color indicates depth-of-coverage. Color range is 5.9 to 14 in all images. Black regions have 6 or fewer coverages and white regions have 14 or more coverages. 8 coverage areas are indicated in blue. Click on the thumbnails to see full-size JPEG maps. | |