
on WISE profile-fitting photometry

 |
The effect of PSF smearing on WISE profile-fitting photometry |
 |
The attitude of the WISE spacecraft is stabilized by a pair of star trackers. If both are functioning, the pointing is expected to be sufficiently stable that no appreciable drift will occur during an integration period. If one of the star trackers is disabled, however, significant drift could occur, resulting in a smearing of point spread function (PSF). The purpose of this study is to assess the degree to which this smearing biases the fluxes estimated during profile-fitting photometry.
The basic procedure in these simulations was similar to that used
in our previous
Investigation of WPHot flux biases.
The difference in this case,
however, was the use of smeared PSFs in data generation.
Specifically, synthetic
data were generated for an 11x11 set of isolated point sources on a sky
background with Gaussian additive noise, with the source images being smeared
uniformly
along a straight line whose length was varied. Profile-fitting source
extraction was then
carried out using unsmeared PSFs, and the resulting magnitude
differences (estimated - true) determined for various smearing lengths
and signal to noise ratios. The PSFs used in the present study
were those from a multi-orbit simulation by
N. Wright in May, 2009. From those simulations we generated a 5x5 grid
of PSFs covering the focal plane, and have been using them to test our
data processing pipeline. Figure 1 shows a sample PSF, uncertainty map,
and smeared PSF.
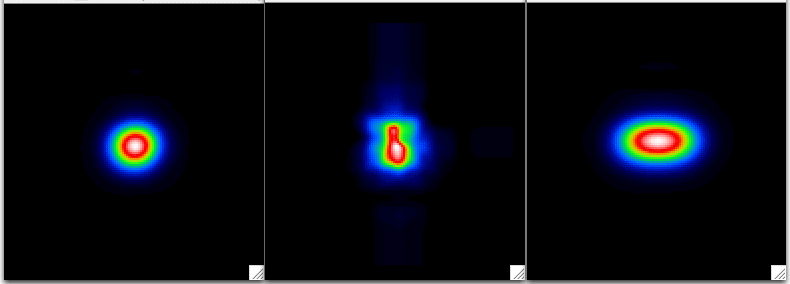 |
| Fig 1: Left: Central PSF in band 1; Center: PSF uncertainty (peak value = 1.5% of PSF peak); Right: PSF smeared by 10 arcsec. The field of view is 22 arcsec and the intensity scale is linear. |
Figure 2 shows a plot of the Band 1 magnitude bias a function of signal to
noise ratio (SNR) in the absence of smearing. For a more detailed discussion
on the peculiarities of this plot, please see
Investigation of WPHot flux biases.
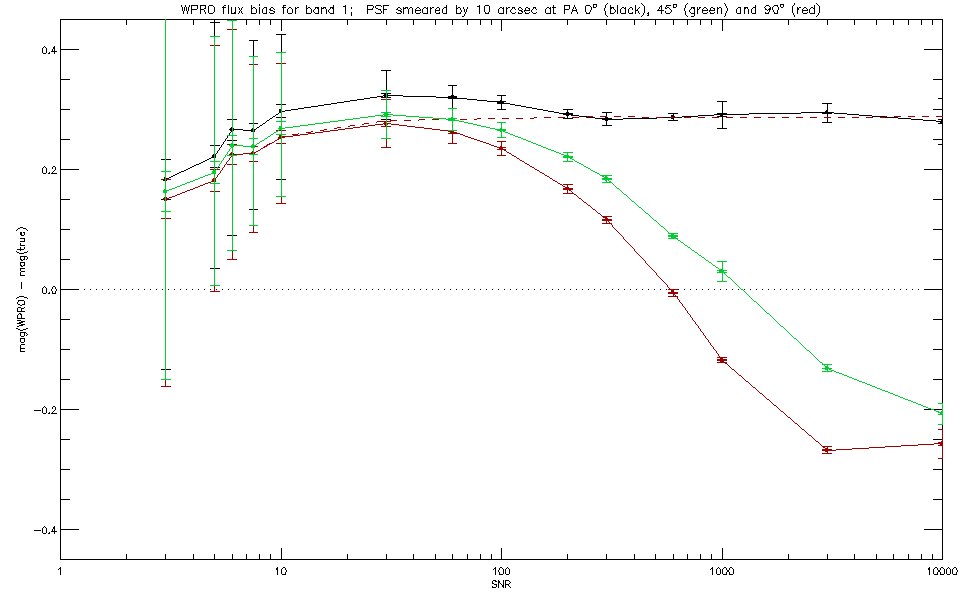 |
| Fig 3: Photometric flux bias at band 1, resulting from PSF smearing. . |
The red curve was obtained using the smeared PSF shown in the right-hand panel in Figure 1; the unsmeared version of the curve is shown in Figure 2. It is apparent that the bias is of opposite sign for low SNR as compared to high SNR. This behavior is due to the non-uniform weighting resulting from PSF error, represented by the PSF uncertainty map in the center panel of Figure 1. When the photometry is repeated using uniform weighting (corresponding to uniform background noise and zero PSF uncertainty), the red dashed line in Figure 3 is obtained. The bias is then approximately constant over the full range of SNR. Normally what happens is that the flux is underestimated when the PSF is too small, but this becomes reversed when the PSF uncertainty has a compact localized peak. The reason is that the data are then de-emphasized in the central portion of the PSF, allowing a least squares fit with higher source flux.
Because of the latter effect, asymmetries in the PSF uncertainty map
cause the photometric bias to be dependent on the position angle of
the smearing in the high-SNR regime (the regime in which PSF errors
dominate). The red curve in Figure 3 represents one extreme of this.
The other extreme is represented by the black curve in Figure 3, whereby
the smearing is in the y-direction, i.e., along the direction
of elongation of the PSF uncertainty. The green curve represents the
intermediate case, i.e. a position angle of 45 deg.
Figure 4 shows the photometric bias as a function of smearing length
for all four bands. A standard SNR value of 30 was chosen for this
plot, since it is in the background-dominated regime, relatively free from
the vagaries associated with geometric effects with the PSF uncertainty.
In Figure 5, the (estimated - true) magnitude differences for each
band have been replotted as a function of smearing length expressed as
a fraction of the effective width of the PSF (6.63, 7.11, 9.49, 15.31 arcsec
for the present PSFs in bands 1-4, respectively), where the effective width
is defined as the square root of 4/pi times the volume to height ratio.
It is apparent that the normalization by PSF width has brought the curves
together, i.e., the flux bias is, to a good approximation, dependent only
on the ratio of smearing length to PSF width, and is otherwise band-independent.
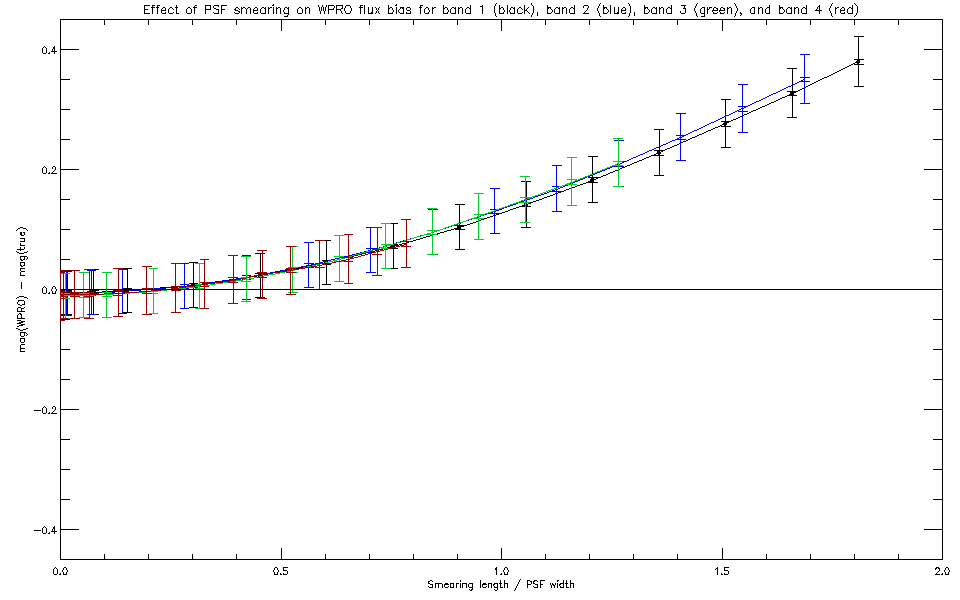 |
| Fig 5: Photometric flux bias as a function of smearing length expressed in units of the effective width of the PSF. |
The corresponding variation of reduced chi squared for each band is shown
in the next figure.
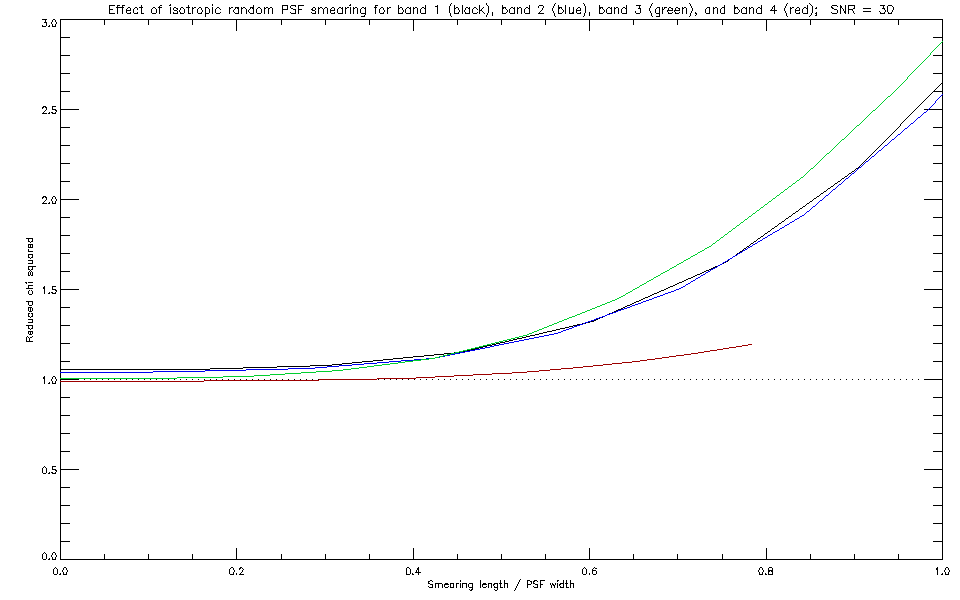 |
| Fig 5b: Reduced chi squared as a function of relative smearing length for SNR = 30. |
The next figure illustrates how the reduced chi squared varies with
SNR for a given smearing length (in this case, equal to half of the
PSF width):
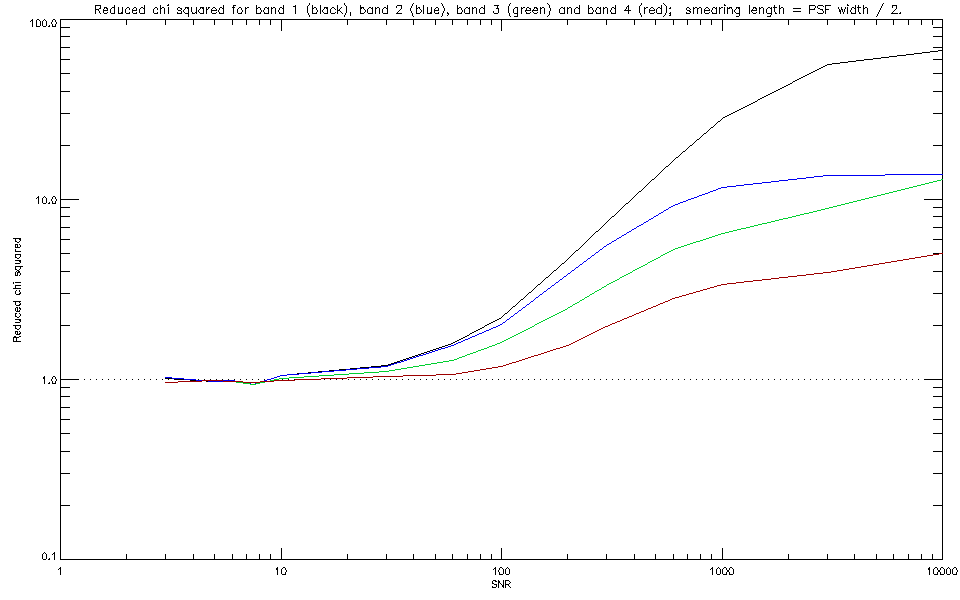 |
| Fig 5c: Reduced chi squared as a function of SNR for a smearing length equal to half of the PSF width at each band. |
Differences in the behavior of reduced chi squared for the different
bands (both as a function of smearing length and SNR) are due to
differences in the PSF uncertainty maps. For example, at large SNR, the
reduced chi squared becomes dominated by the PSF error term in the noise model,
and for the present PSF set this tends to be larger for the longer
wavelength bands. This is reflected in the lower values of reduced chi
squared for band 4 in Figure 5c.
For the particular set of PSFs currently being used in WISE simulations:
1. At a given band, the flux bias increases monotonically with smearing length, as expected.
2. In the high SNR regime, the bias is strongly influenced by the details of the PSF uncertainty map, and is therefore dependent on the direction of the smearing.
3. At low to moderate SNR (where Poisson noise dominates), the flux is systematically underestimated, reaching almost 20% at band 1 for a smearing length of 8 arcsec. The severity at the other bands scales closely in inverse proportion to the PSF width.
4. The bias is not strongly influenced by the location of the PSF on the focal-plane array.
5. The reduced chi squared increases with smearing length, as expected.
The rate of the increase is dependent on the signal to noise ratio and
the band-dependent PSF uncertainty.
The above results pertain to the case in which the PSF is uniformly
smeared along a straight line of specified length. We now consider the
case in which the PSF is smeared isotropically by random jitter.
Specifically, we consider
the case where the PSF is subject to Gaussian random position offsets,
uncorrelated in the x and y directions, and define our smearing scale
as the RMS radial offset (i.e., RMS positional jitter), equal to sqrt(2) times
the sigma of position error in either x or y.
Figure 6 shows the effect on the flux bias as
a function of smearing scale at each of the four bands.
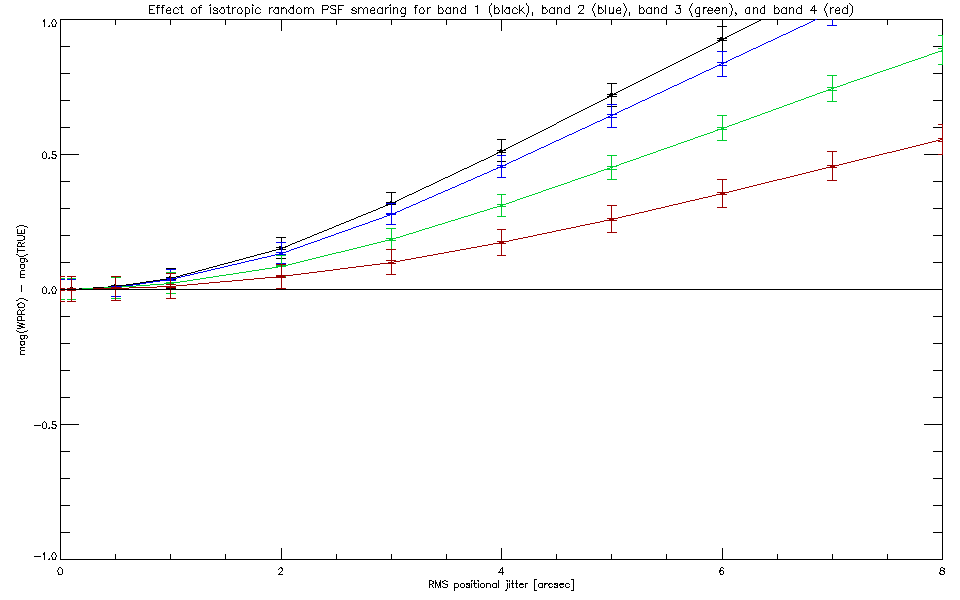 |
| Fig 6: Photometric flux bias due to isotropic smearing of the PSF, for SNR = 30. |
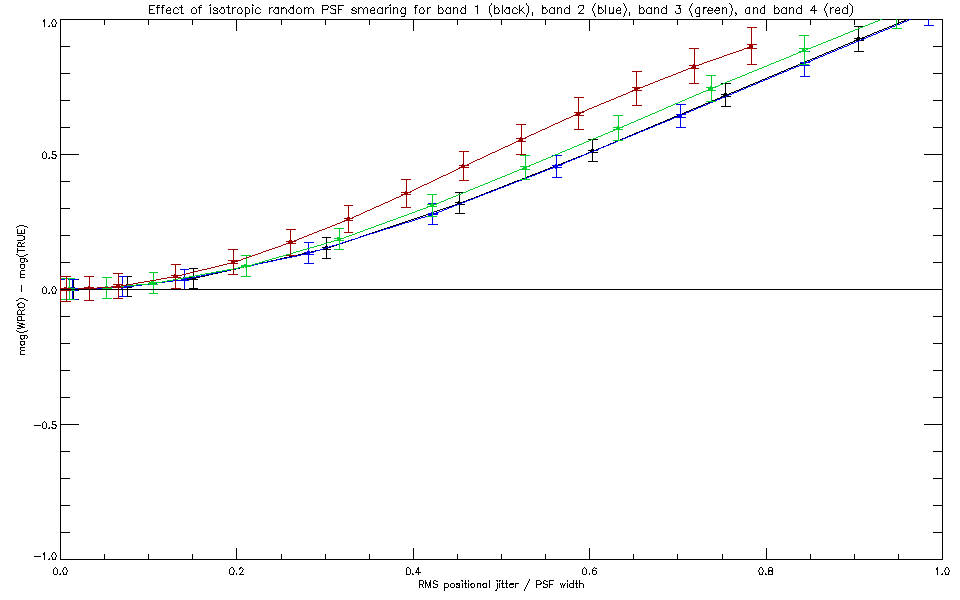 |
| Fig 7: Photometric flux bias due to isotropic smearing of the PSF as a function of smearing scale in units of the PSF width. The assumed SNR was 30. |
Just as for the linear smearing case, the flux bias is, to a reasonably good
approximation dependent on the ratio of smearing scale to PSF width, and
is otherwise more or less band-independent.
For comparison, the result for large SNR is shown in the next figure.
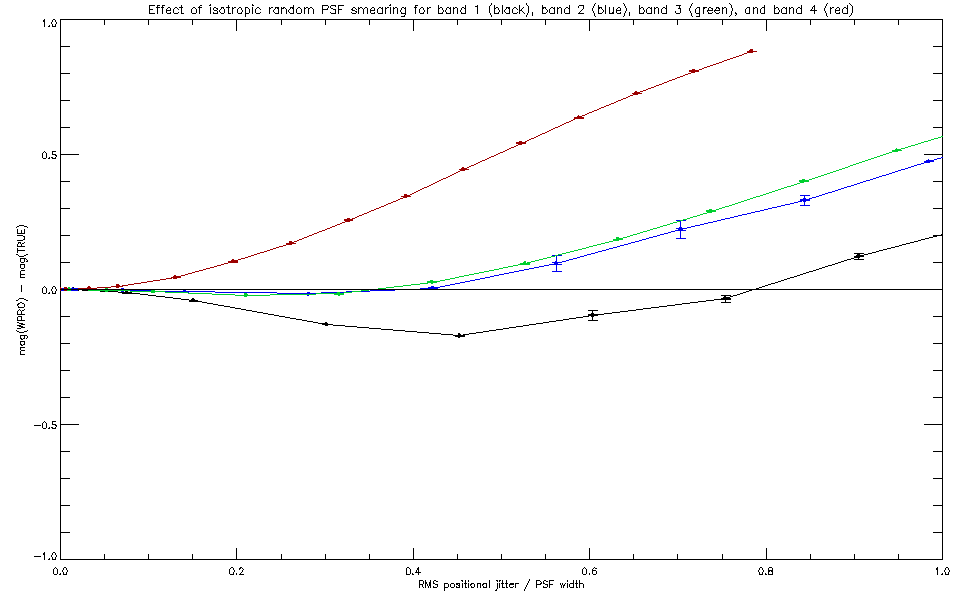 |
| Fig 8: Photometric flux bias due to isotropic smearing of the PSF as a function of smearing scale in units of PSF width. Large SNR case. |
The behavior in this case is clearly more complicated, and is due to the
interaction between the PSF broadening and the non-uniform weighting due
to the spatial variation of PSF uncertainty. The simple band-independent
variation of flux bias with the ratio of smearing scale to PSF width
has been destroyed by the band-to-band differences in the uncertainty maps.
The next two figures show the reduced chi squared as a function of
normalized smearing scale for the moderate and high SNR cases, respectively.
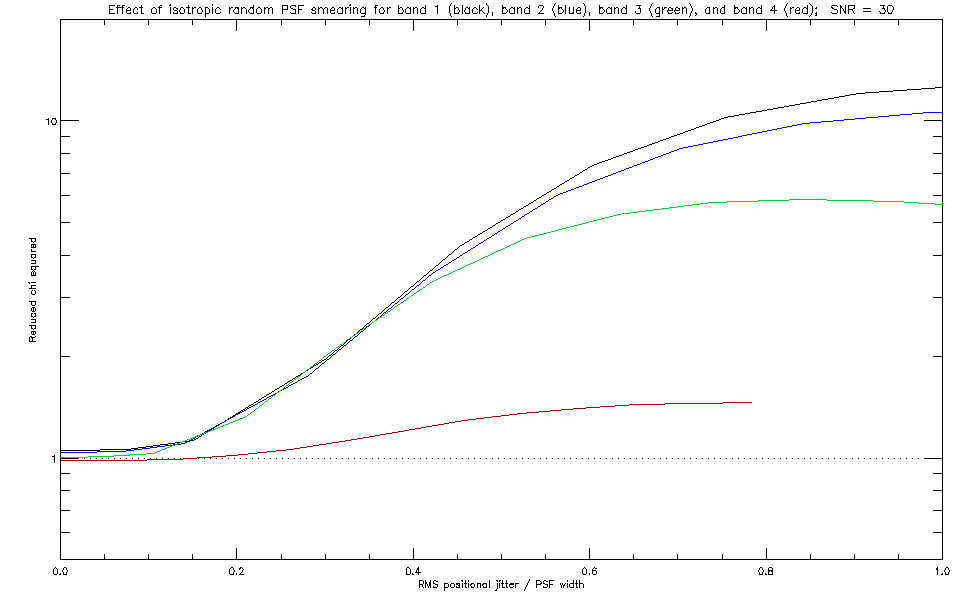 |
| Fig 9: Reduced chi squared as a function of normalized smearing scale for SNR = 30. |
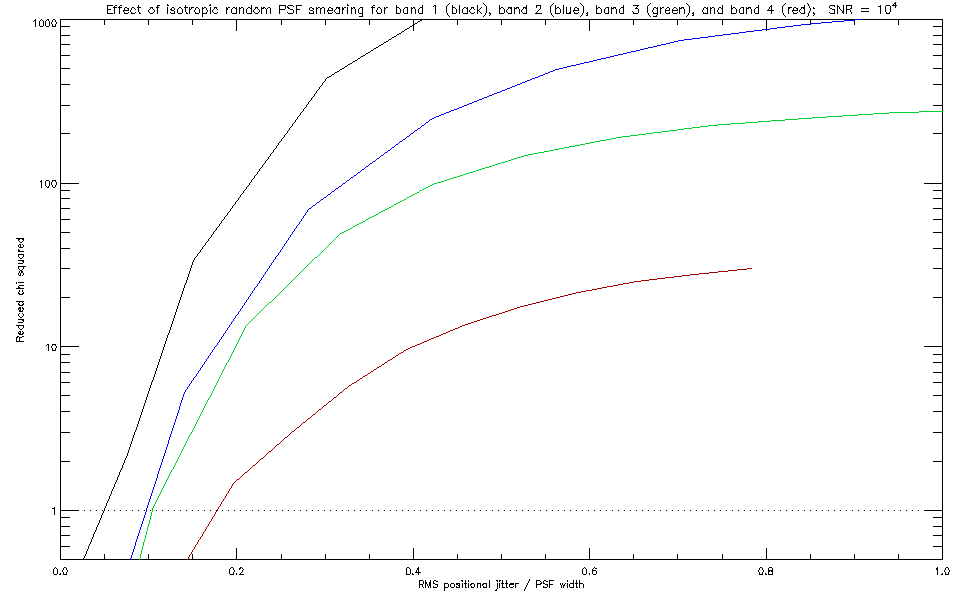 |
| Fig 10: Reduced chi squared as a function of normalized smearing scale for large SNR. |
Comparison with the linear smearing results shows that the effects of isotropic smearing are far more severe. For example, Figure 7 indicates that for an RMS positional jitter of half the PSF width, the magnitude bias is 0.4. This level of jitter corresponds to a smearing function whose FWHM is 0.83 of the PSF width. Comparing this with Figure 5 shows that the magnitude bias for the equivalent amount of linear smearing is approximately 0.1, i.e. a factor of 4 less severe. This factor holds for other values of smearing length also.