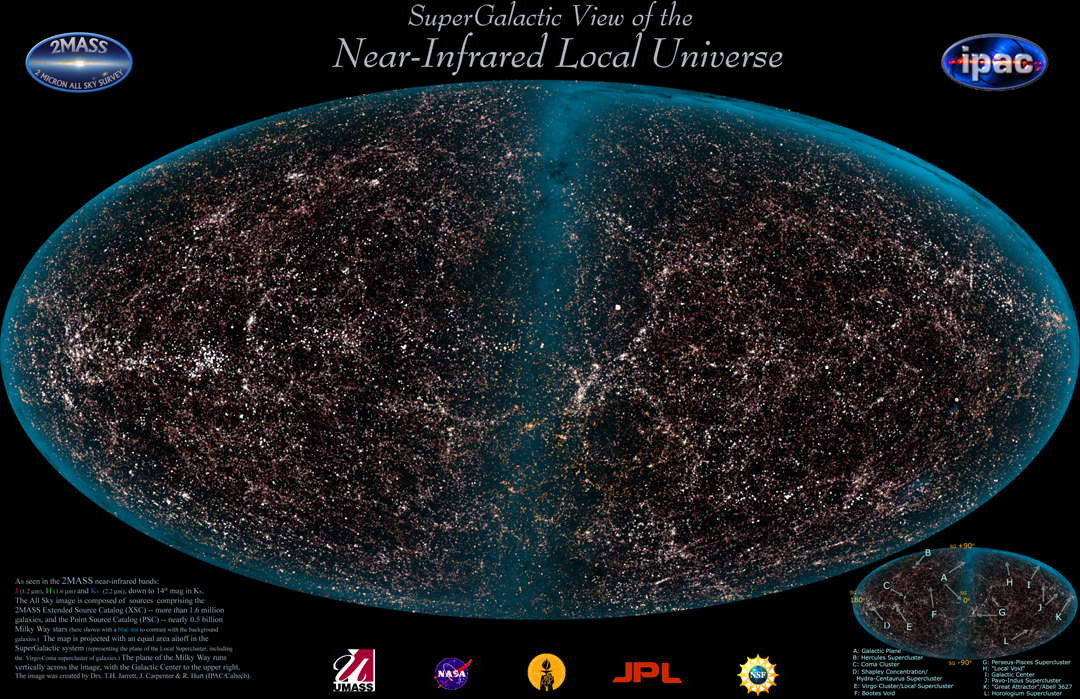
2MASS Extended Source Catalog (XSC)
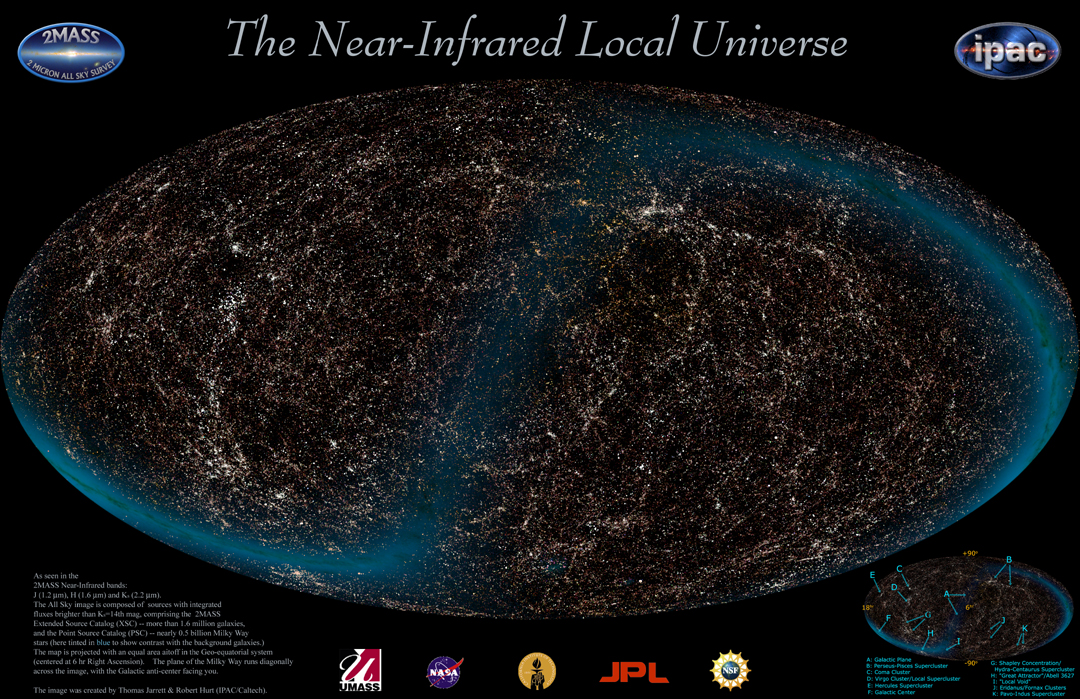
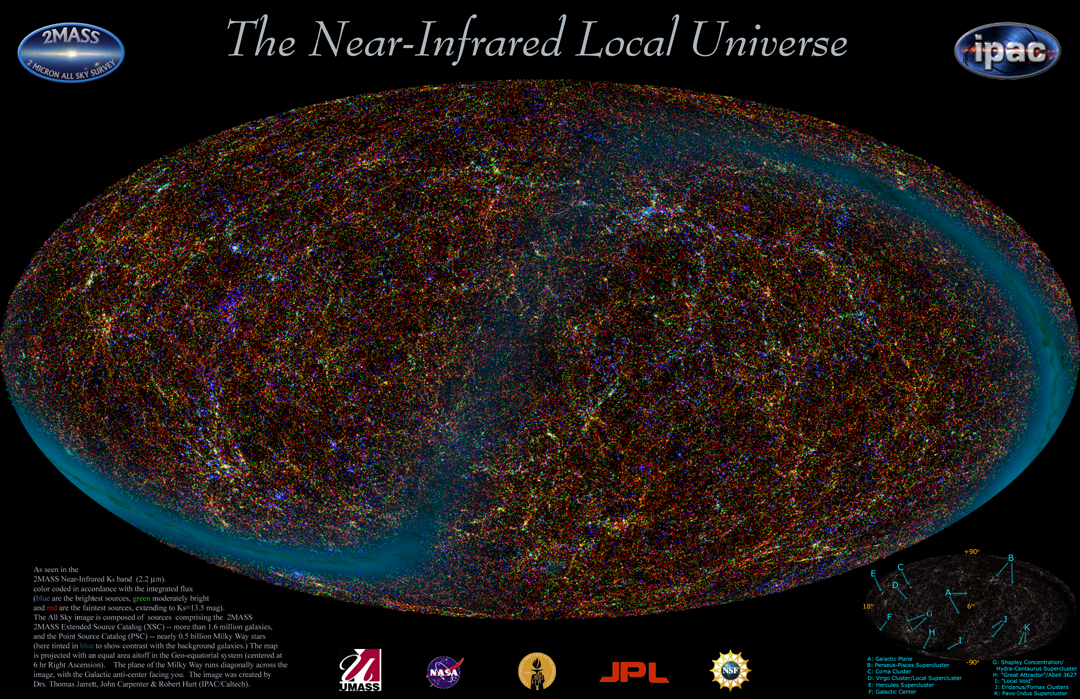
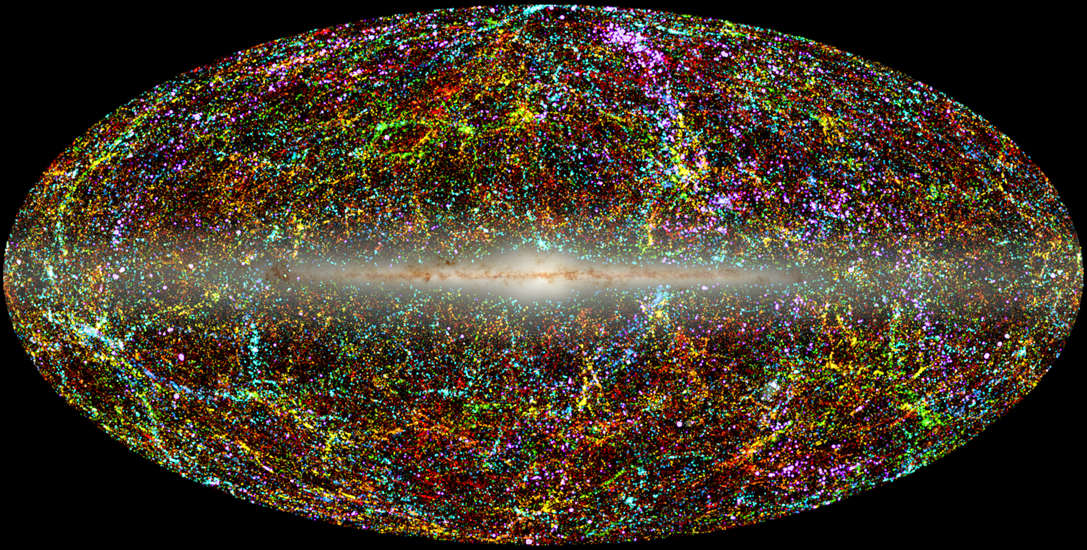
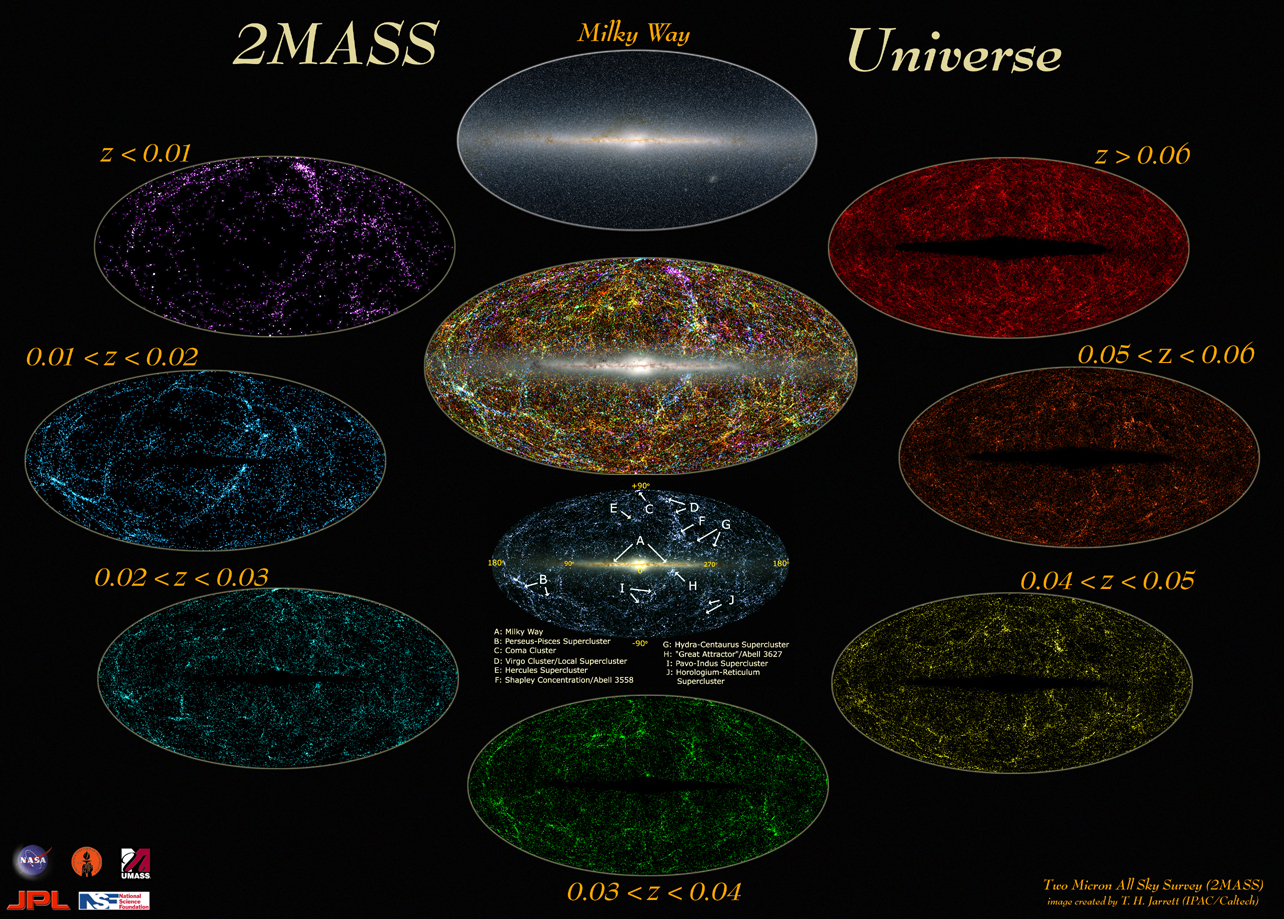
Aitoff equal-area projection (w/ 18' pixels) of the integrated XSC flux for Ks < 14.0 mag (1.7 mJy). The near-Infrared J, H, and Ks-bands have been RGB combined to form a color image of the Local Universe. The image orientation is equatorial centered on 6hr right ascension (roughly corresponding to the Galactic anti-center); see the equatorial coordinate map. The "red" sources defining the Galactic Plane are mostly Milky Way in origin, both heavily dust reddened as well as being intrinsically red (due to strong emission lines in the Ks-band window). The Galactic anti-center region (center of image) is also graced by the Orion and Taurus molecular cloud systems (Orion located just right and down from the center of the image, Taurus just right and up from the center). The filaments and coherent structures throughout the image are extragalactic super structures.
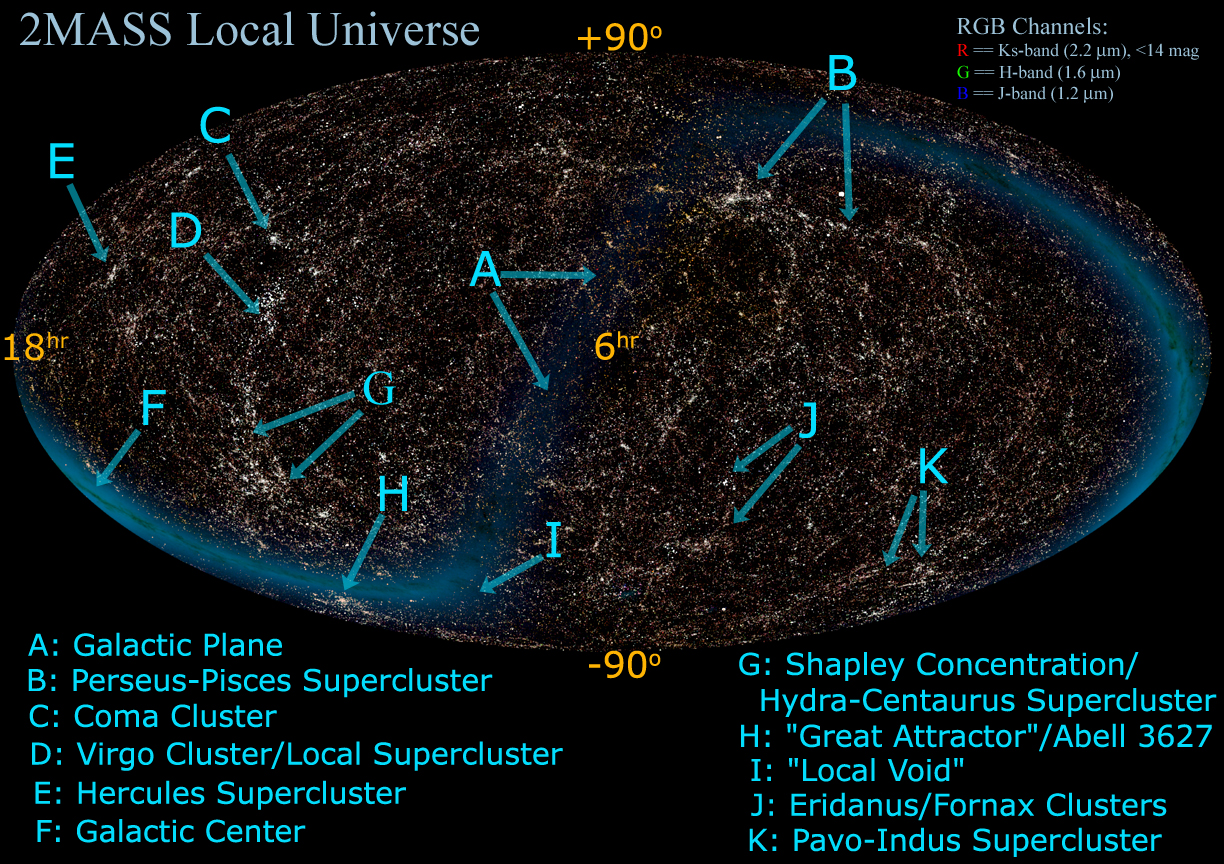
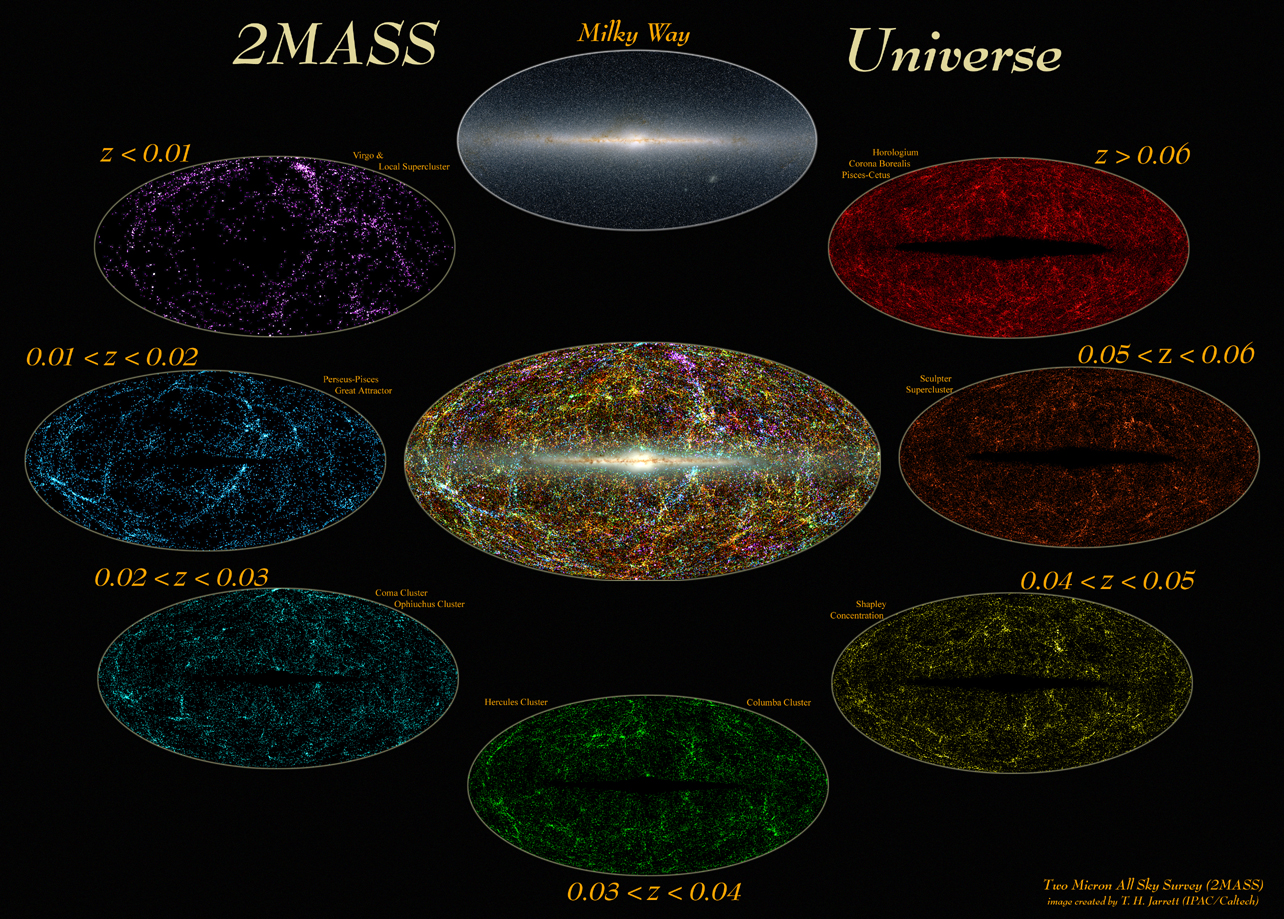
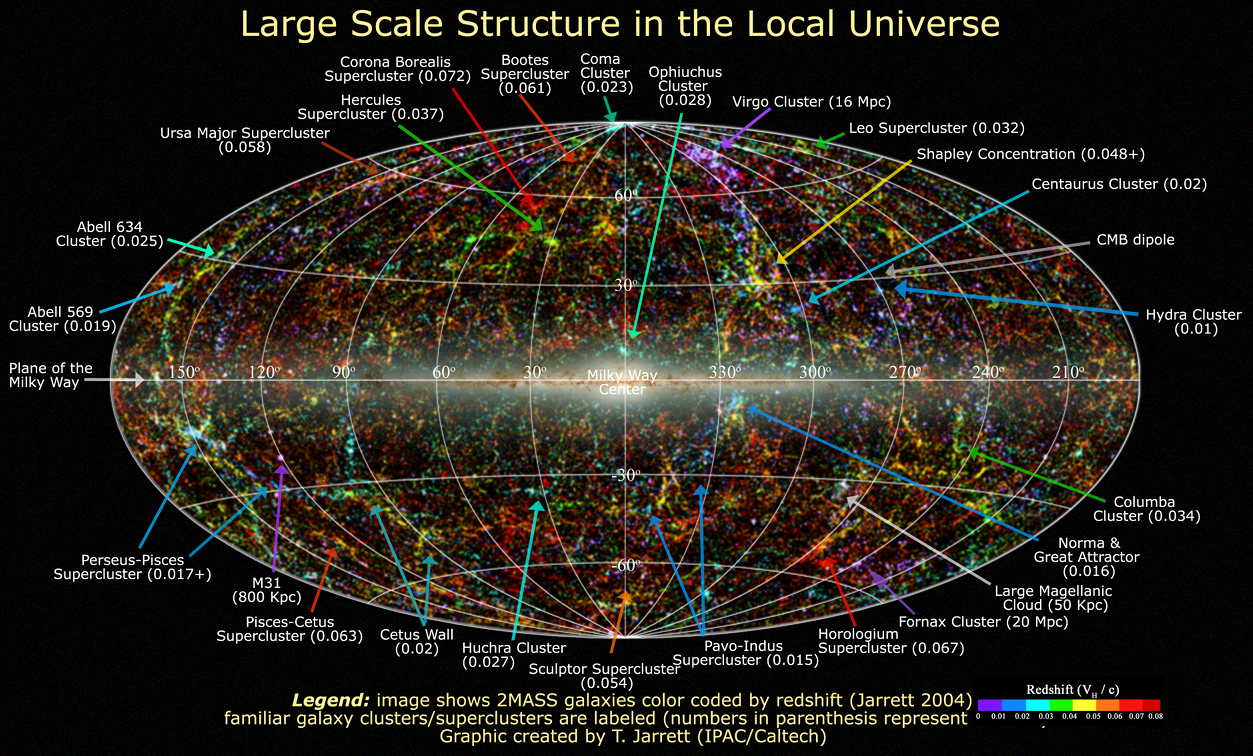
2MASS View of the Local Universe: Chart showing the equatorial orientation and location of Large Scale Structure in the local Universe. The image can be directly compared with the Martha Haynes (Cornell U.) redshift survey images. Here for example is the sky distribution for galaxies with a redshift < 12,000 km/s (z < 0.04): Redshift Distribution of Galaxies.
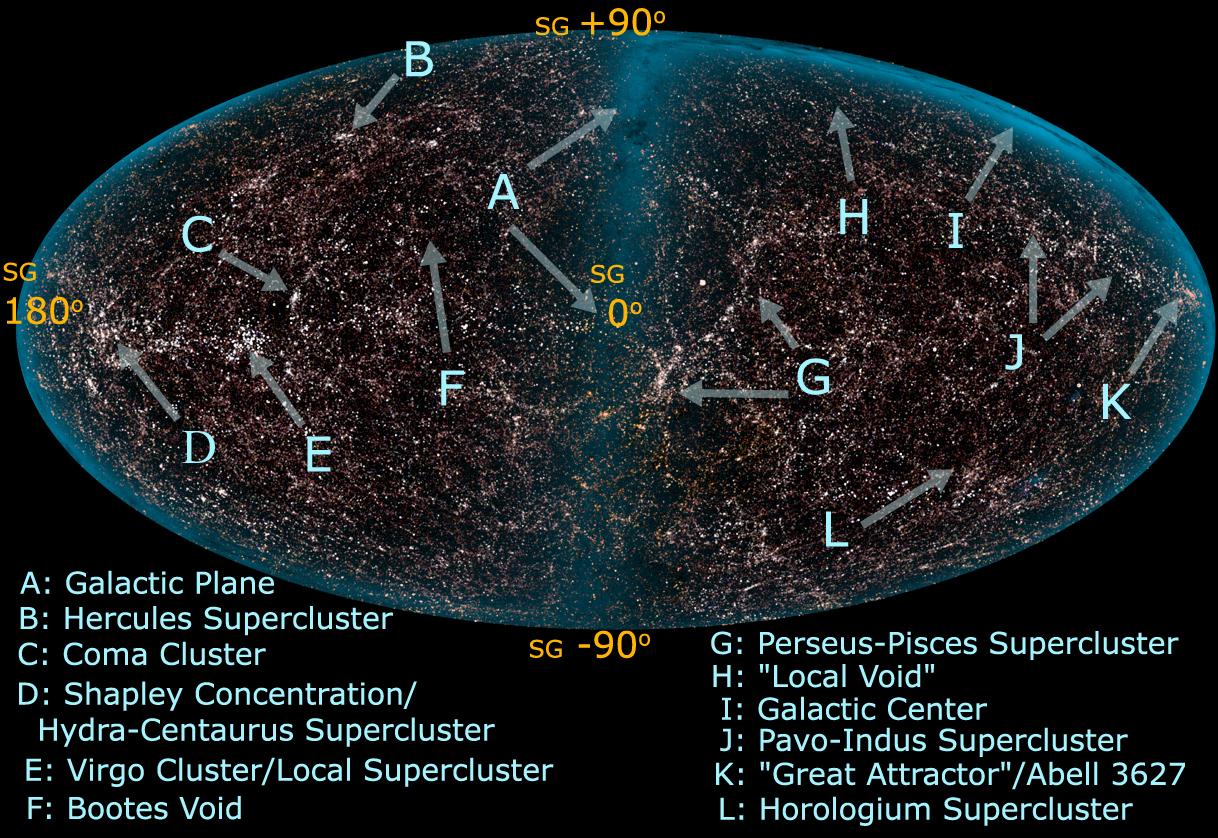 Supergalactic chart
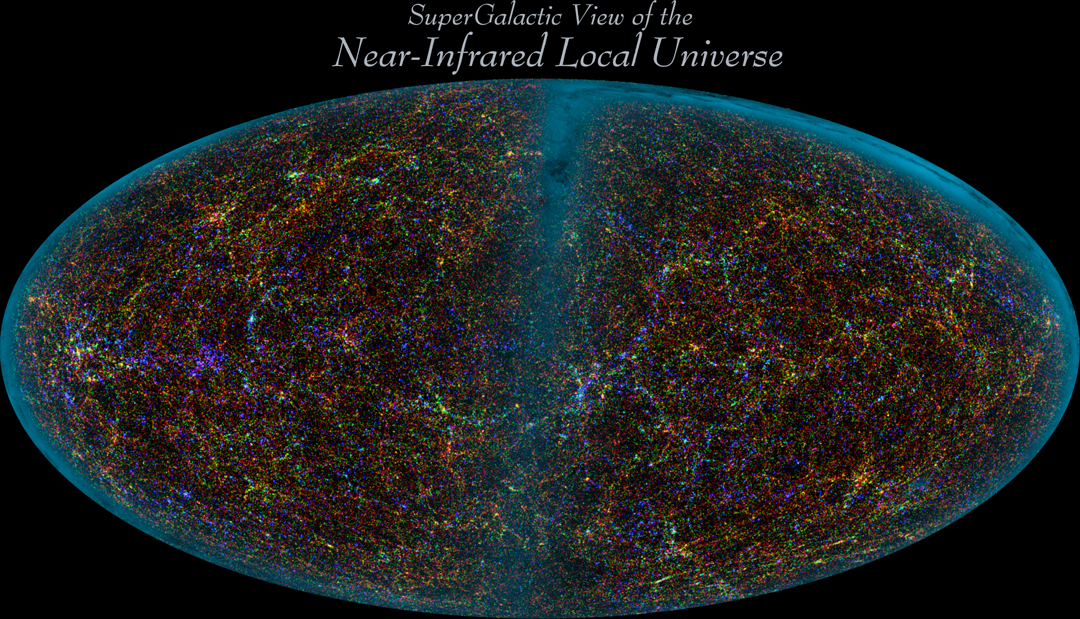
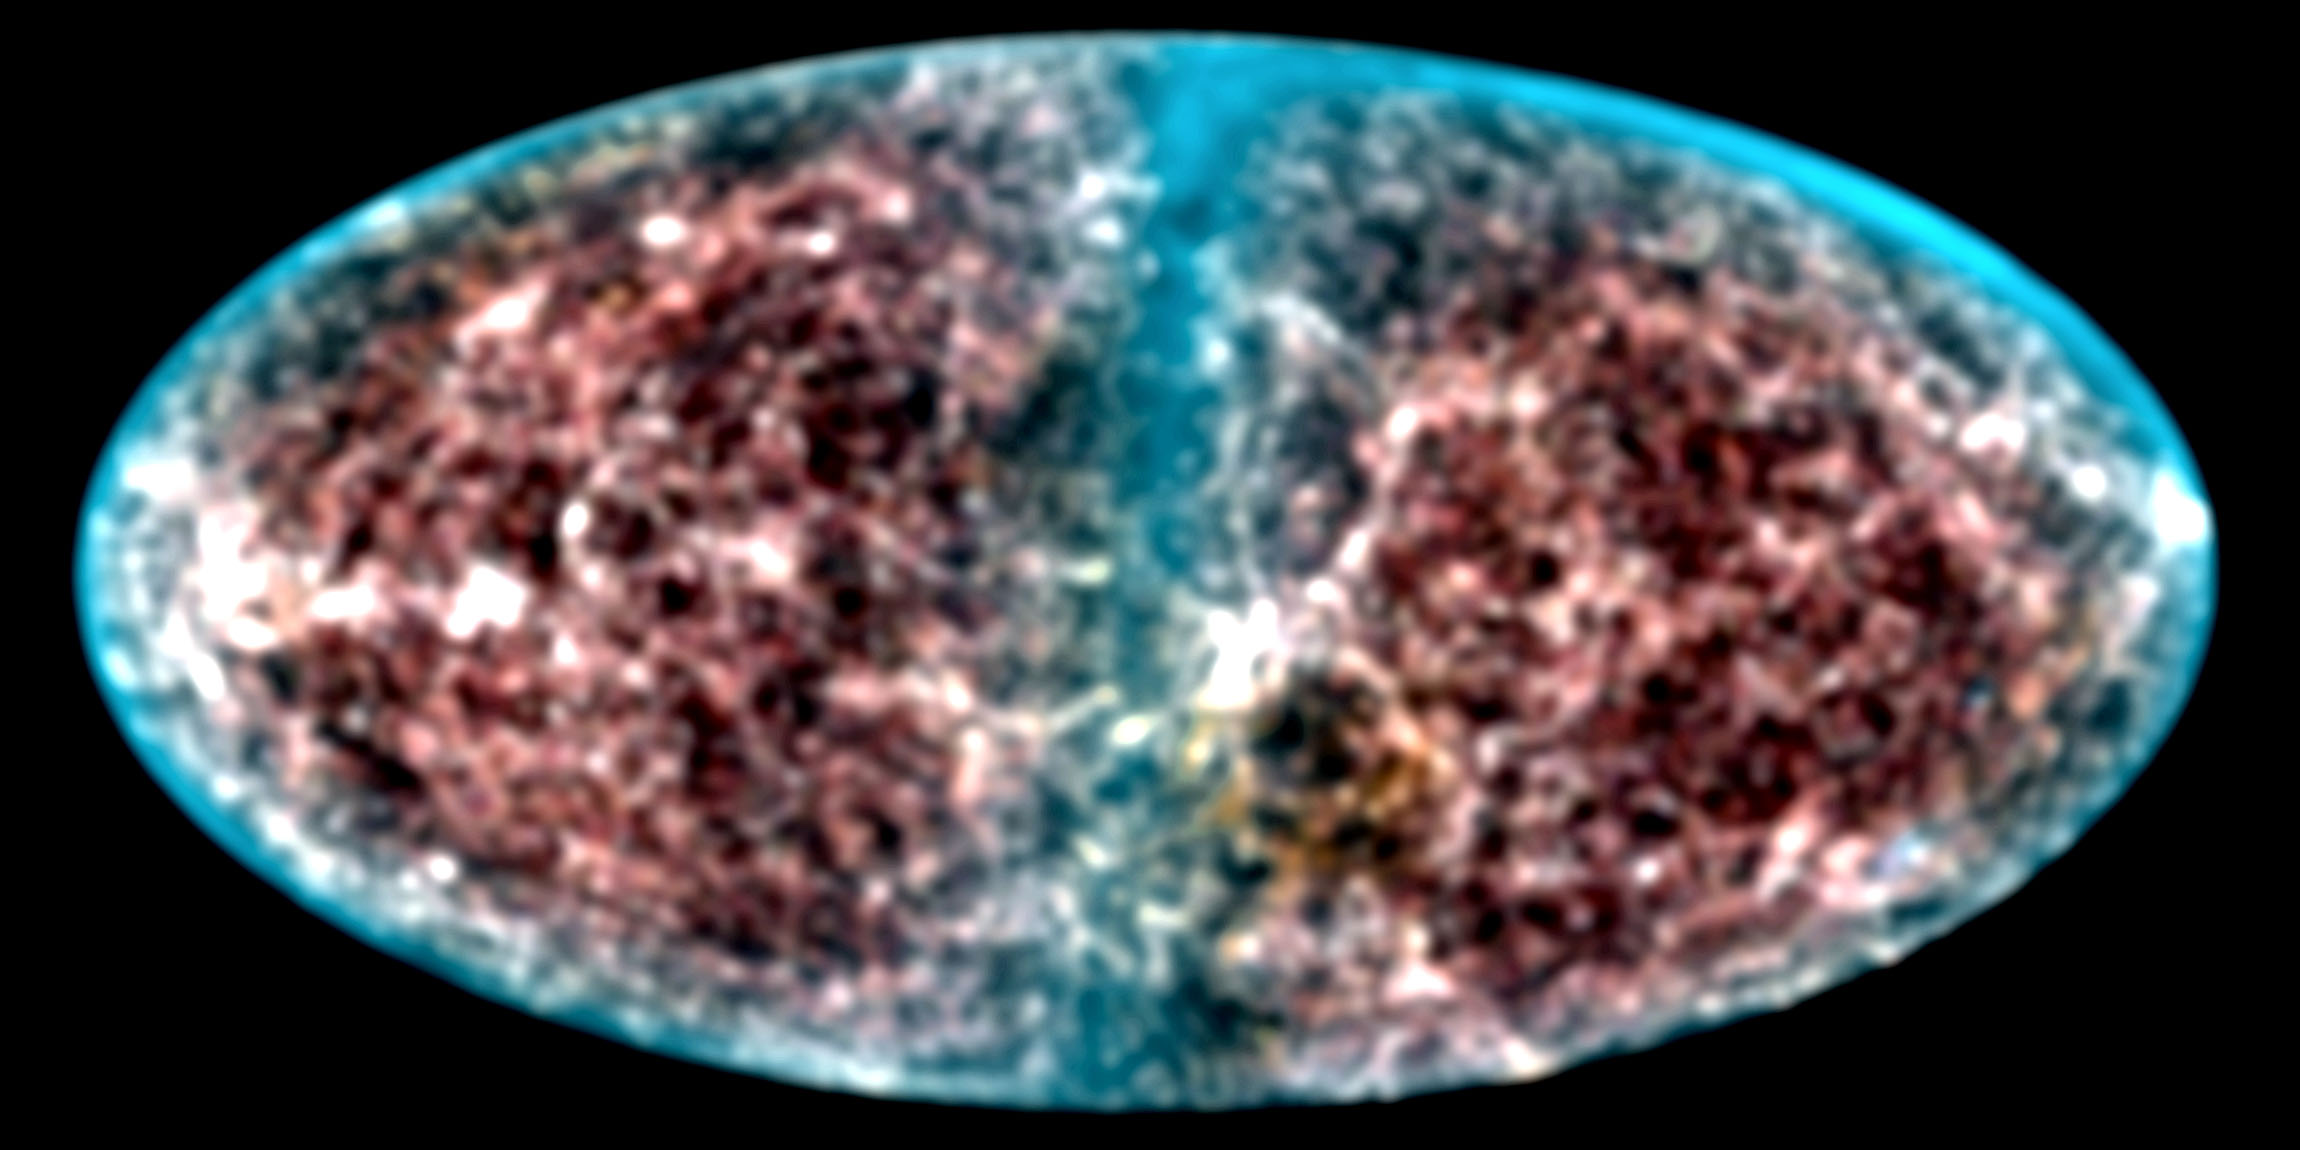 Smoothed Supergalactic Map
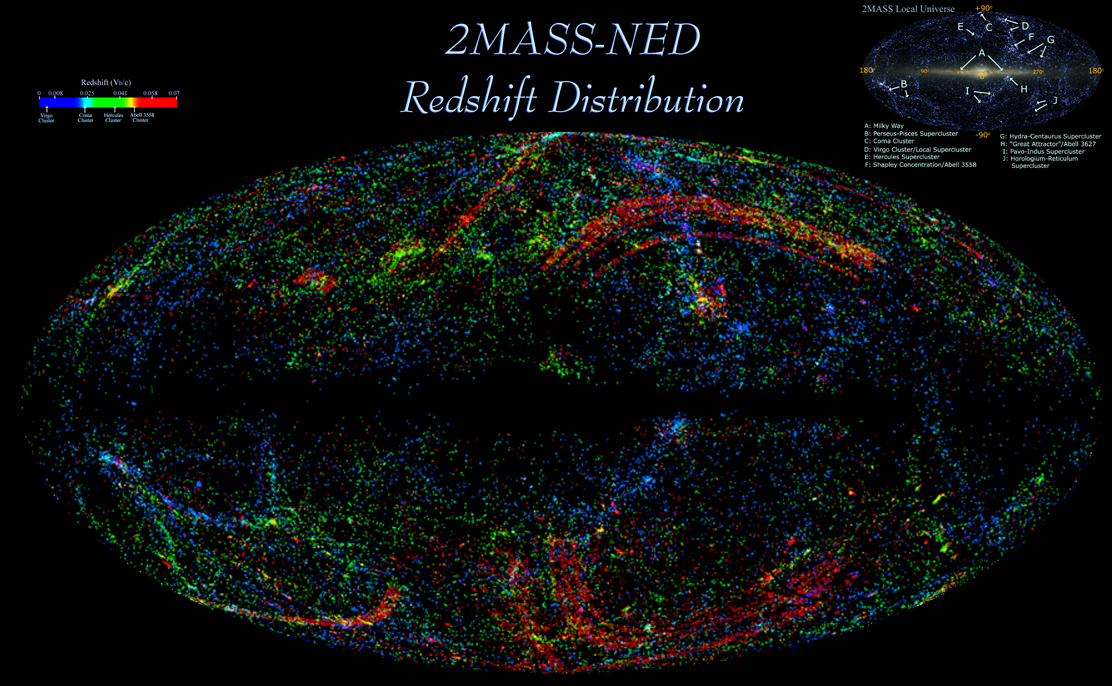