 |
 |
| W1 | W2 |
 |
 |
| W3 | W4 |
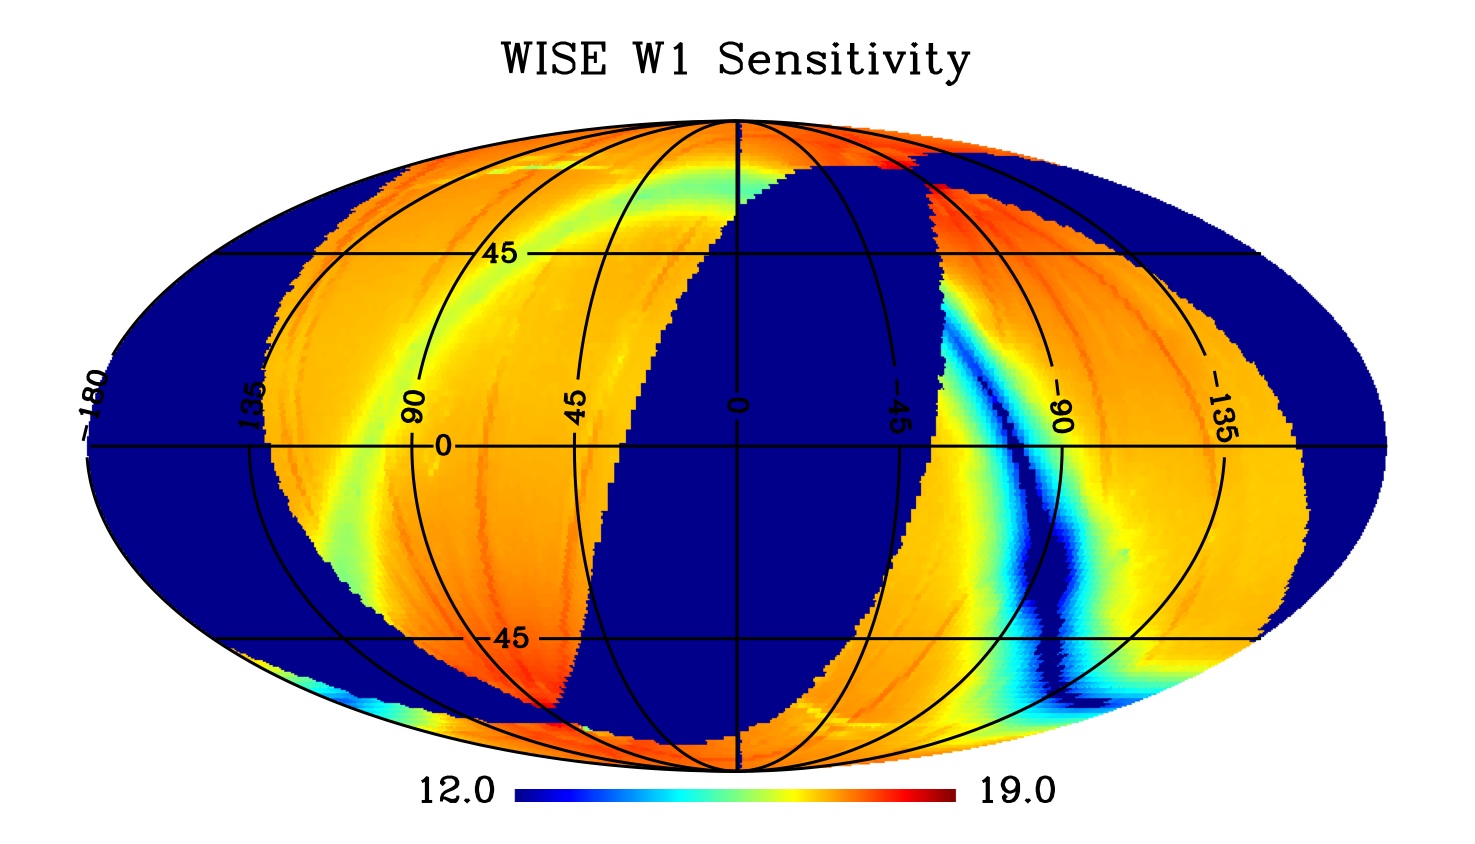
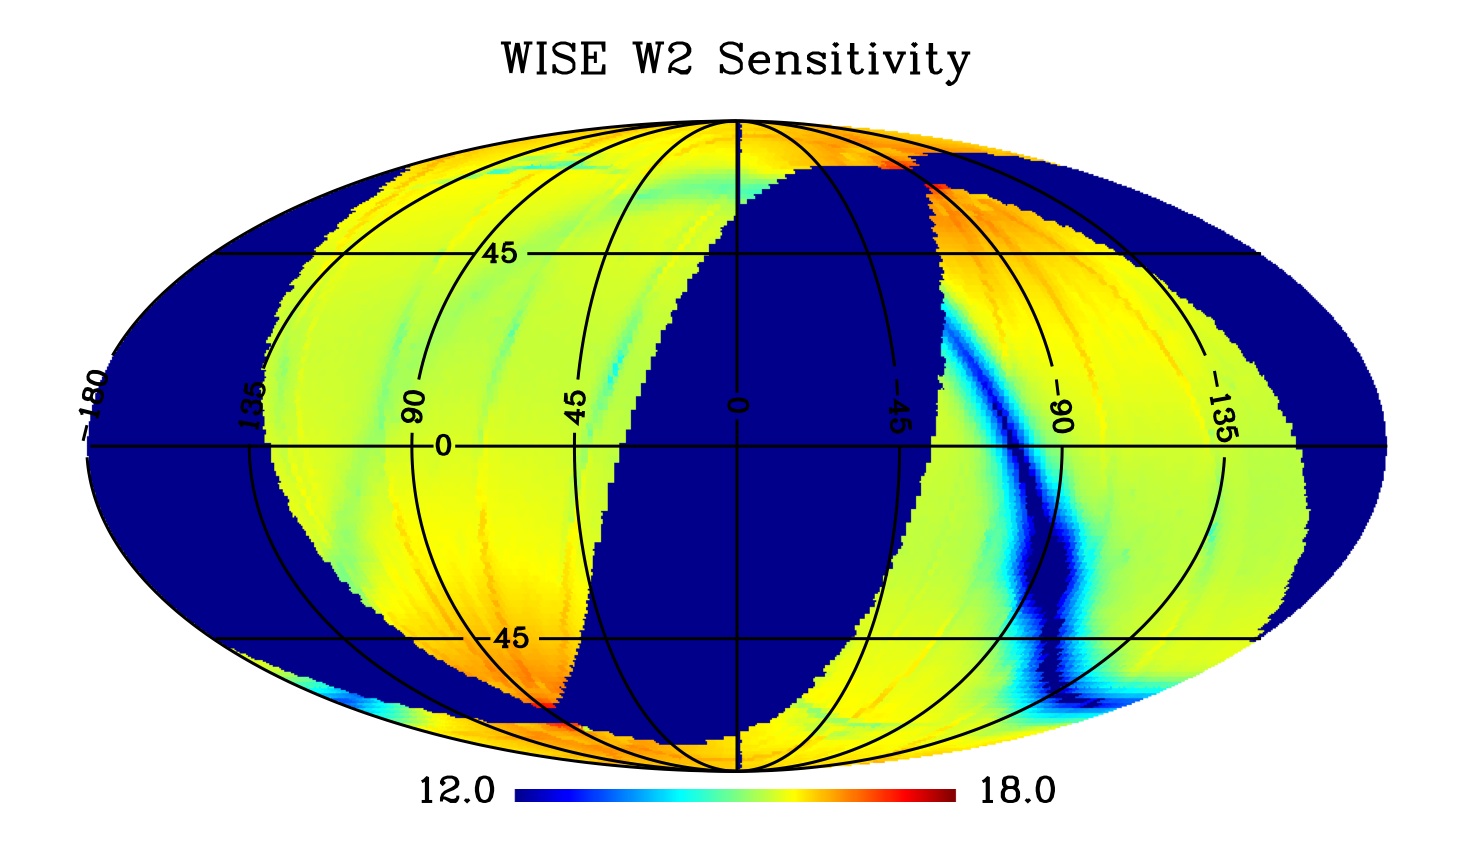
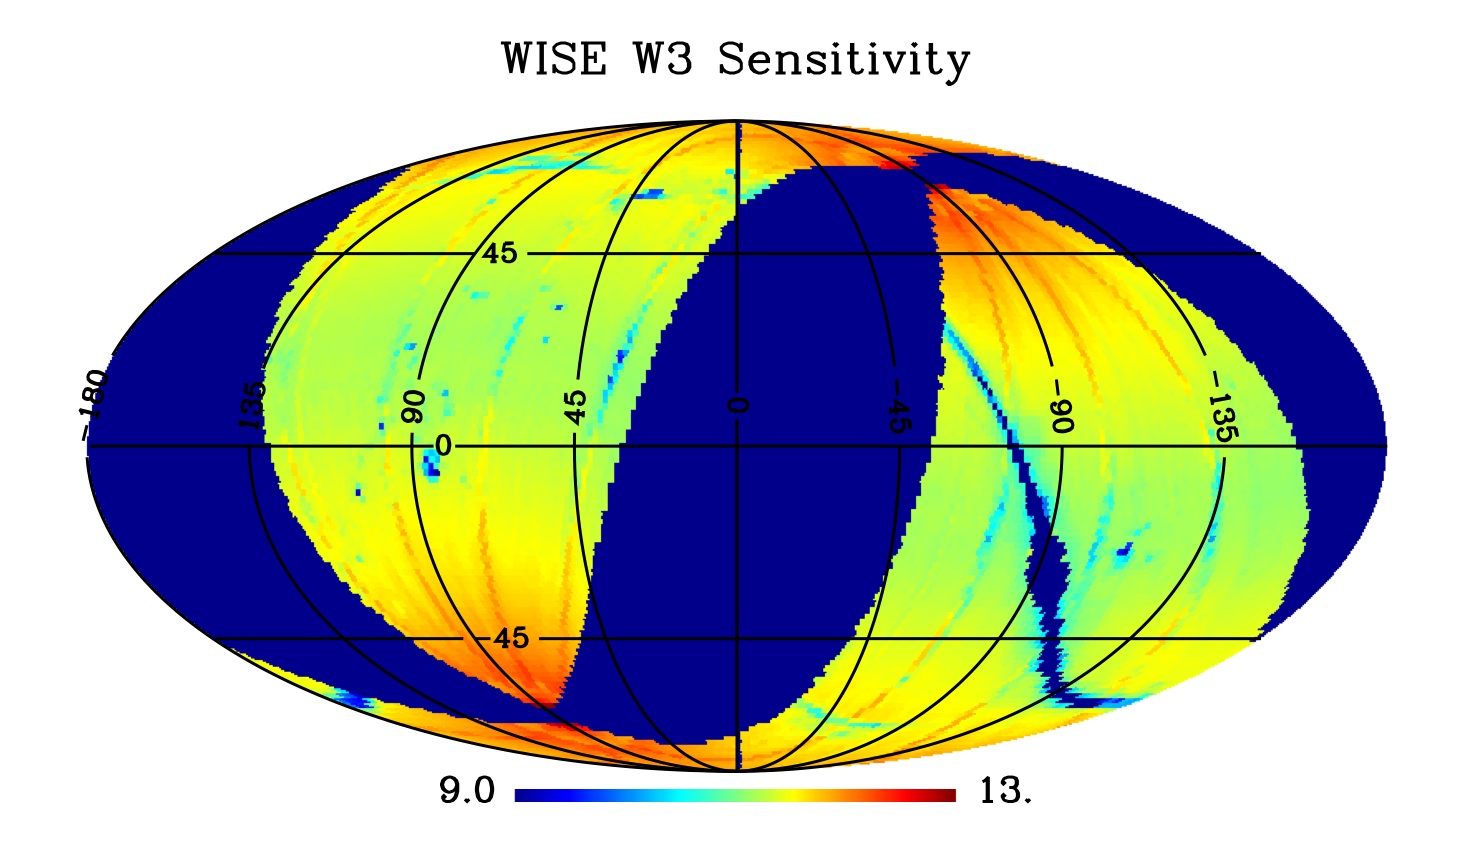
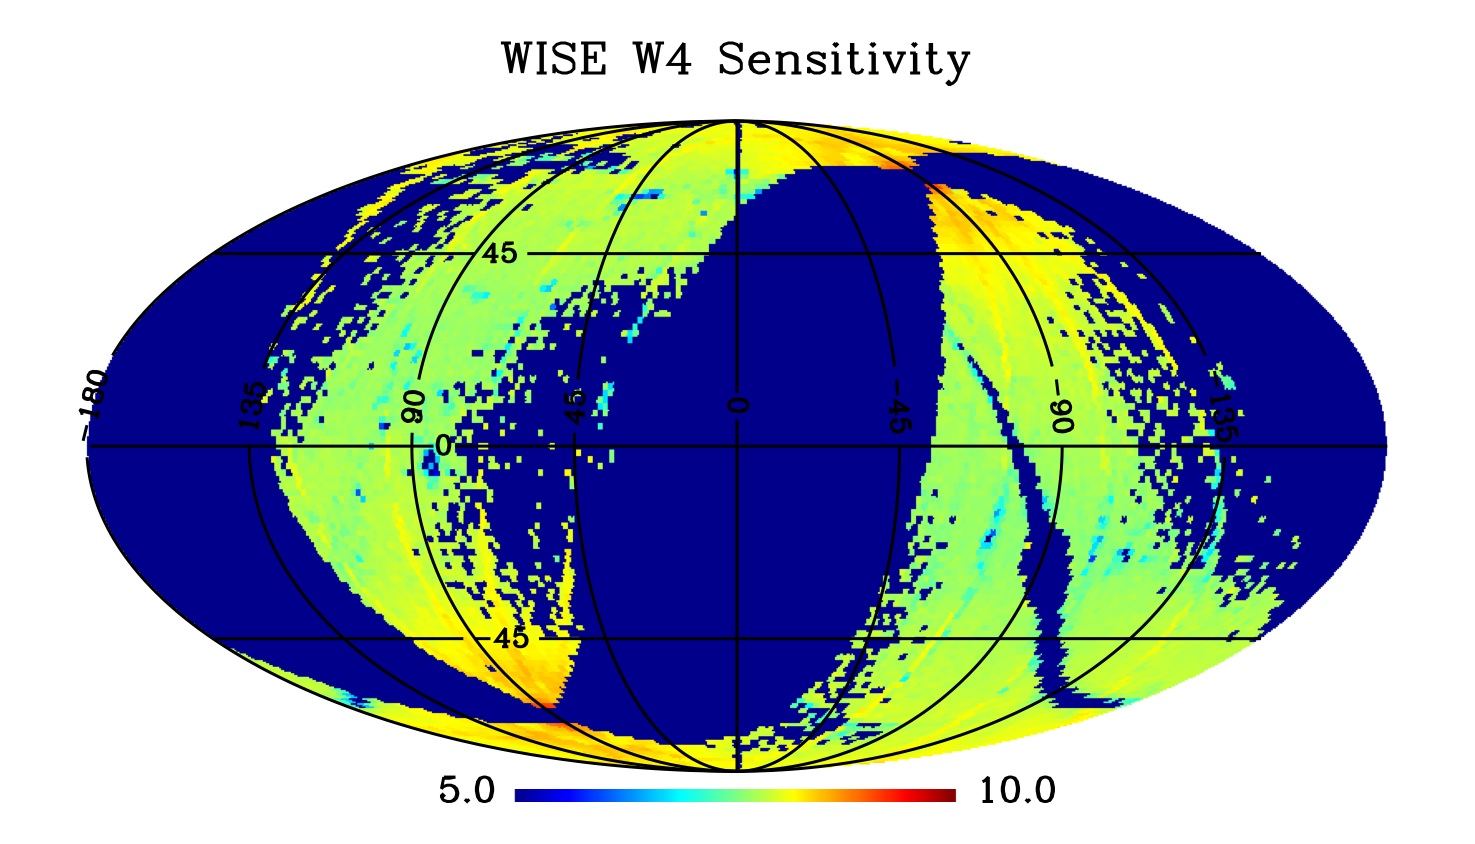
| Figure 1 - Magnitude at SNR 7 vs.position on the sky in the Preliminary Release Source Catalog (equatorial projection). | |
The fundamental objective of WISE is to produce a sensitive mid-infrared all-sky survey. In the 3 to 30 μm wavelength range imaged by WISE the most sensitive previous all-sky surveys include: COBE/DIRBE, which achieved point source sensitivities of roughly 60 Jy at 3.5 and 50 Jy at 4.9 μm (Smith, Price, and Baker 2004 ApJS, 154, 673); IRAS, which achieved 0.2 Jy at 12 and 25 μm; and AKARI, which achieved 50 mJy at 9 μm and 90 mJy at 18 μm (section 7.6 of AKARI/IRC All-Sky Survey Point Source Catalogue Version 1.0 Release Note (Rev.1). WISE sensitivity varies with position on the sky due to changes in the depth of coverage and the zodiacal foreground emission, both of which improve towards the ecliptic poles, and in the local source density (primarily due to Galactic sources) which limits sensitivity because of confusion.
Taking 10 exposures per position as the depth of coverage achieved over 95% of the Preliminary Release area in W1 and W2, and 9 coverages in W3 and W4, zodiacal emission levels near the ecliptic, and high Galactic latitude source density, the estimated WISE sensitivities are given in Table 1 below.
| Band | External Check1 | Noise Model2 | Internal Repeatability3 |
|---|---|---|---|
| W1 (3.4 μm) | 0.048/17.02 | 0.040/17.21 | 0.039/17.23 |
| W2 (4.6 μm) | 0.100/15.57 | 0.079/15.83 | 0.083/15.78 |
| W3 (12 μm) | 0.73/11.5 | 0.68/11.57 | 0.76/11.46 |
| W4 (22 μm) | 5.9/7.87 | 4.8/8.09 | 5.2/8.0 |
Notes to Table 1
|
|||
Table 1 includes sensitivity estimates from comparison to external photometry from Spitzer and 2MASS, as well as from the profile-fit photometry noise model and the internal repeatability of WISE photometry. Because the local source density does not vary in repeated WISE observations of a given source, the internal repeatability estimates do not include the effect of confusion.
Figure 1 shows the variation in the noise model sensitivity estimates over the Preliminary Release area in the four WISE bands.
|
|
| W1 | W2 |
|
|
| W3 | W4 |
| Figure 1 - Magnitude at SNR 7 vs.position on the sky in the Preliminary Release Source Catalog (equatorial projection). | |
Sensitivity can be assessed using WISE measurements of sources with accurately known fluxes from other data. The 3.6 and 4.5 μm bands of the Infrared Array Camera (IRAC) on the Spitzer Space Telescope are similar to the W1 and W2 bands on WISE, and the 24 μm band of Spitzer's Multi-band Imaging Photometer for Spitzer (MIPS) is similar to the WISE W4 band. Of course Spitzer data is only available for a small fraction of the all-sky area covered by WISE. When available, Spitzer's 85 cm primary mirror (vs. 40 cm for WISE) and 1.2" IRAC and 2.55" MIPS 24 μm pixels (vs. 2.75" for W1, W2, W3; 5.5" for W4) provide image quality twice as good as achieved by WISE in similar bands. Spitzer exposure times on a source are often many times longer than WISE, which with the larger aperture and better image quality allow Spitzer to reach fluxes many times fainter than WISE. Therefore magnitudes from Spitzer in these bands (hereafter referred to as [3.6], [4.5], and [24]) provide a "truth set" for evaluating the limiting flux sensitivity in W1, W2, and W4.
For the 12 μm W3 band, there is no closely comparable Spitzer filter, and other data sources do not provide substantial numbers of sources with fluxes below 1 mJy. However when expressed in Vega magnitudes, the 5σ sensitivity of W3=11.5 corresponds to much brighter stellar photospheres than the >14 mag 2MASS limits (Skrutskie et al 2006, AJ, 131, 1163). The < 3" FWHM of 2MASS is also better than WISE, so by selecting stars based on their 2MASS morphologies and colors, W3 magnitudes can be predicted.
The Spitzer Wide-area InfraRed Extragalactic Survey (SWIRE) imaged six fields covering almost 50 square degrees with IRAC and MIPS. The XMM-LSS field of SWIRE, centered at at 02h 21m 19.08s -04d 29m 58.0s, is especially useful for assessing the WISE Preliminary Release sensitivity, because it is within the Preliminary Release area, and has a relatively low ecliptic (-17.5°) and high galactic (-60°) latitude, making it representative of the performance achieved by WISE in unconfused regions over the bulk of the survey.
IRAC [3.6] and [4.5] magnitudes were downloaded from the SWIRE XMM_LSS Region Spring '05 Spitzer Catalog with the requirement that they have 3.6 μm fluxes > 30 μJy. To ensure a compact source whose flux could be compared to the WISE point source fitting photometry measurements, the SWIRE 3.6 μm aperture corrected flux in the 4.1" radius aperture was required to be less than 10% larger than that in the 1.9" radius aperture. This returned 60,545 sources.
Those sources were uploaded and matched to W1 and W2 photometry in the WISE Preliminary Release Working Database, requiring a matching radius of 2", that the WISE extended source flag (ext_flg) was 0 and the proximity to a 2MASS extended source (xscprox) was null, and that the contamination and confusion flags (cc_flags) were 0 in all four WISE bands. Note that this database includes sources that are not in the released Catalog, because they have WISE SNR<7. In addition, to minimize potential color terms and AGN, the Vega-system color was required to be [3.6]-[4.5] < 0.2. This matching process returned 16,730 sources which should have comparable IRAC [3.6] and WISE W1 photometry.
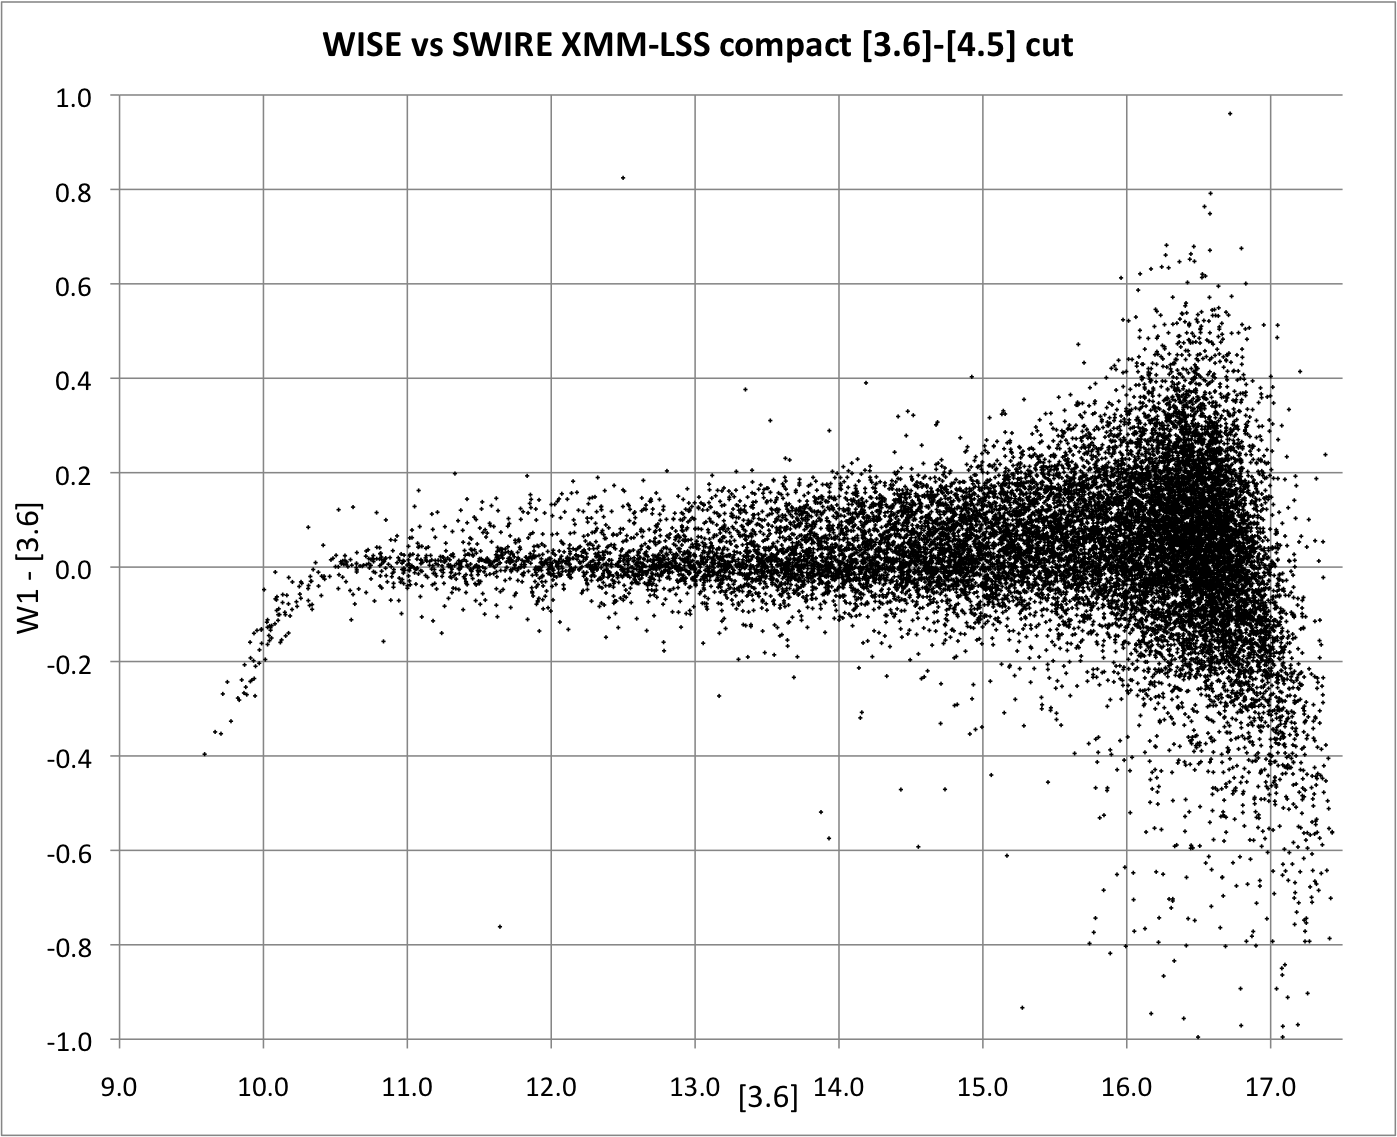
Figure 2 shows a plot of W1-[3.6] vs [3.6]. Sources with fainter (larger) W1 than [3.6] magnitudes are systematically absent due to incompleteness at the faint end in W1. Nevertheless, in the main distribution sources with [3.6] > 15 have a median W1 - [3.6] color of 0.07, probably because W1 is centered at 3.4 μm and the population is becoming increasingly dominated by galaxies with redder SEDs than stars have.
 |
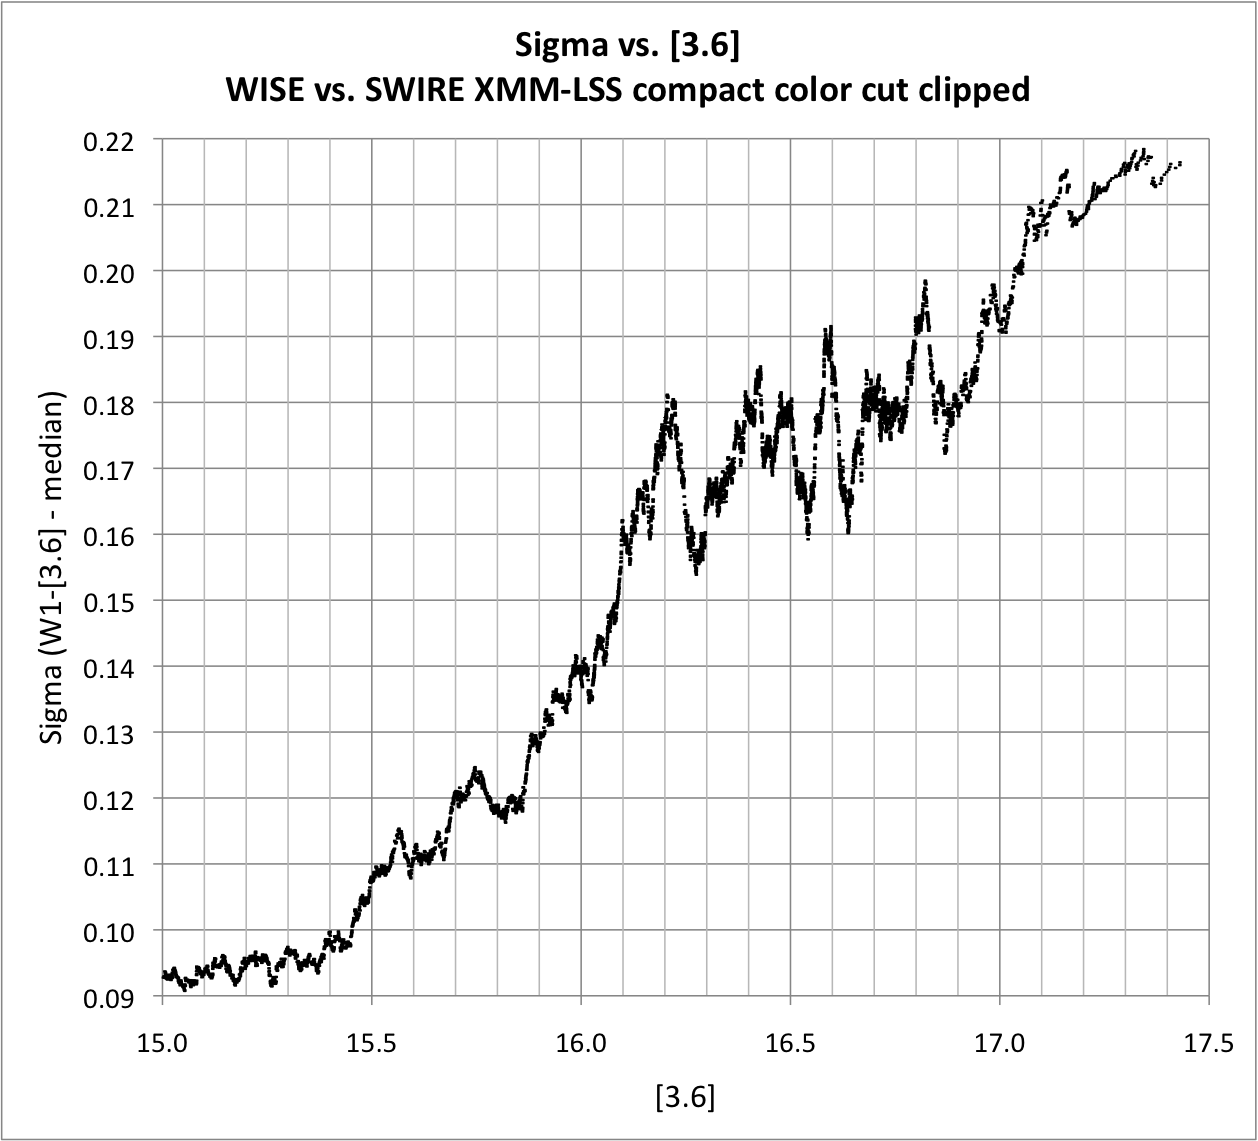 |
| Figure 2 - WISE W1 - SWIRE [3.6] photometry vs. [3.6] in the XMM-LSS field. | Figure 3 - rms W1 - [3.6] error vs [3.6] in the XMM-LSS field. |
To estimate the W1 sensitivity, the sigma in W1 - [3.6] - 0.07 was calculated for a moving window including 400 objects at a time and plotted against the median [3.6] in that window in Figure 3. Since mag = 2.5log10(flux) = [2.5/ln(10)]ln(flux) and thus d(mag) = [2.5/ln(10)] df/f Therefore the rms mag error corresponding to a given SNR=f/df is just 2.5/[SNR*ln(10)] or 1.086/SNR. For SNR=5, the running median rms in W1 - [3.6] is 0.217 mag at [3.6] = 16.95. W1 magnitudes are systematically 0.07 fainter than [3.6], so this corresponds to a 5σ sensitivity of W1=17.02, or 48 μJy.
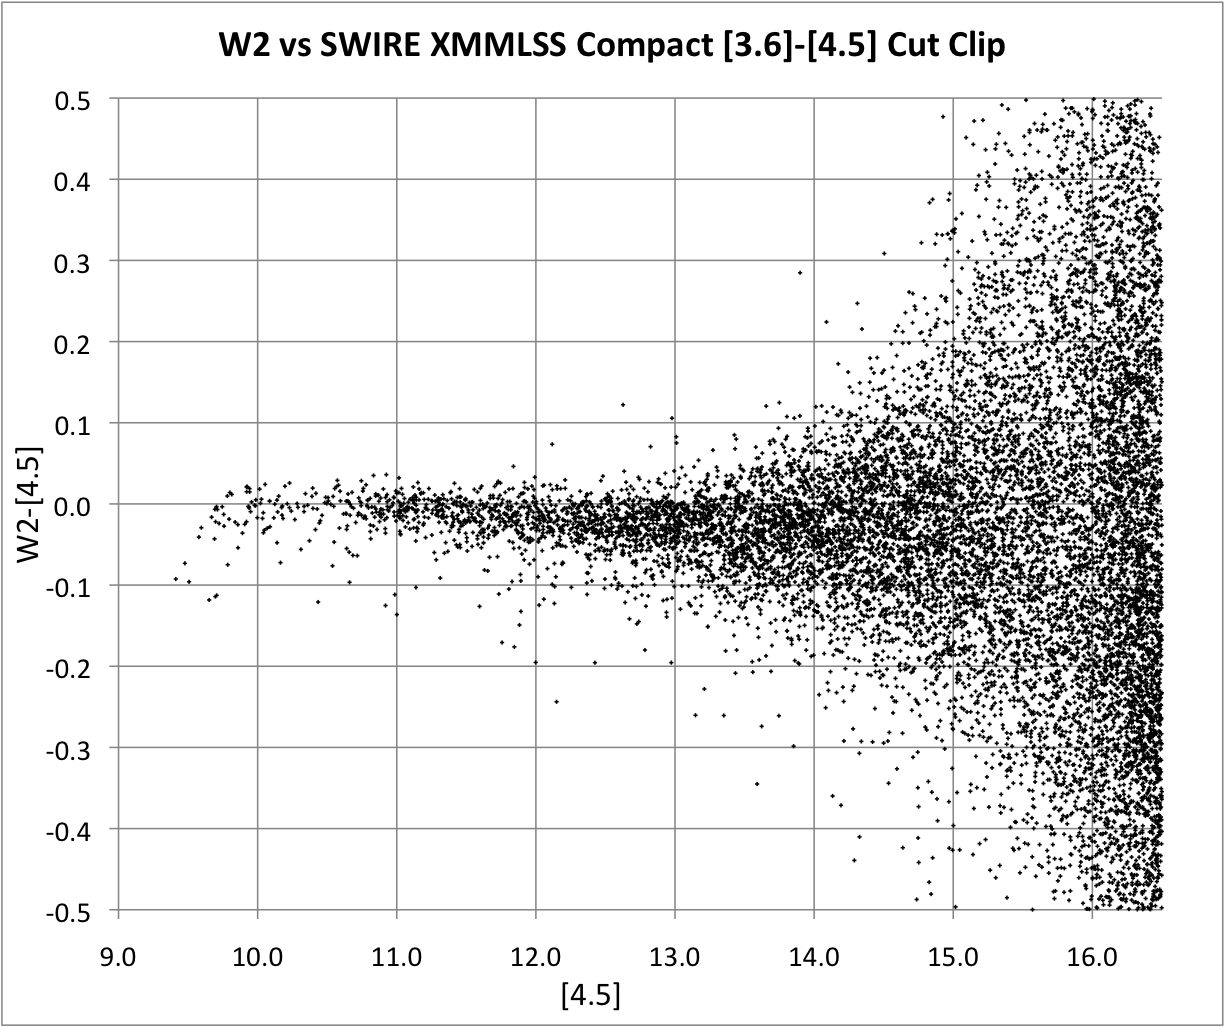
A similar procedure was followed comparing the W2 band to [4.5] XMM-LSS photometry, except that 321 outlier points W2 - [4.5] more than 3σ away from the local trend were removed. Figure 4 shows the resulting plot of W2-[4.5] vs [4.5]. Incompleteness in W2 does not seem to be a factor in this figure, but there is again a trend to redder colors (W2 is 4.6 μm) at faint magnitudes. The median offset at faint magnitudes is W2 - [4.5] = -0.03. Figure 5 shows the running median rms in W2-[4.5] vs. [4.5]. The SNR 5 value is W2=15.57 or 100 μJy.
 |
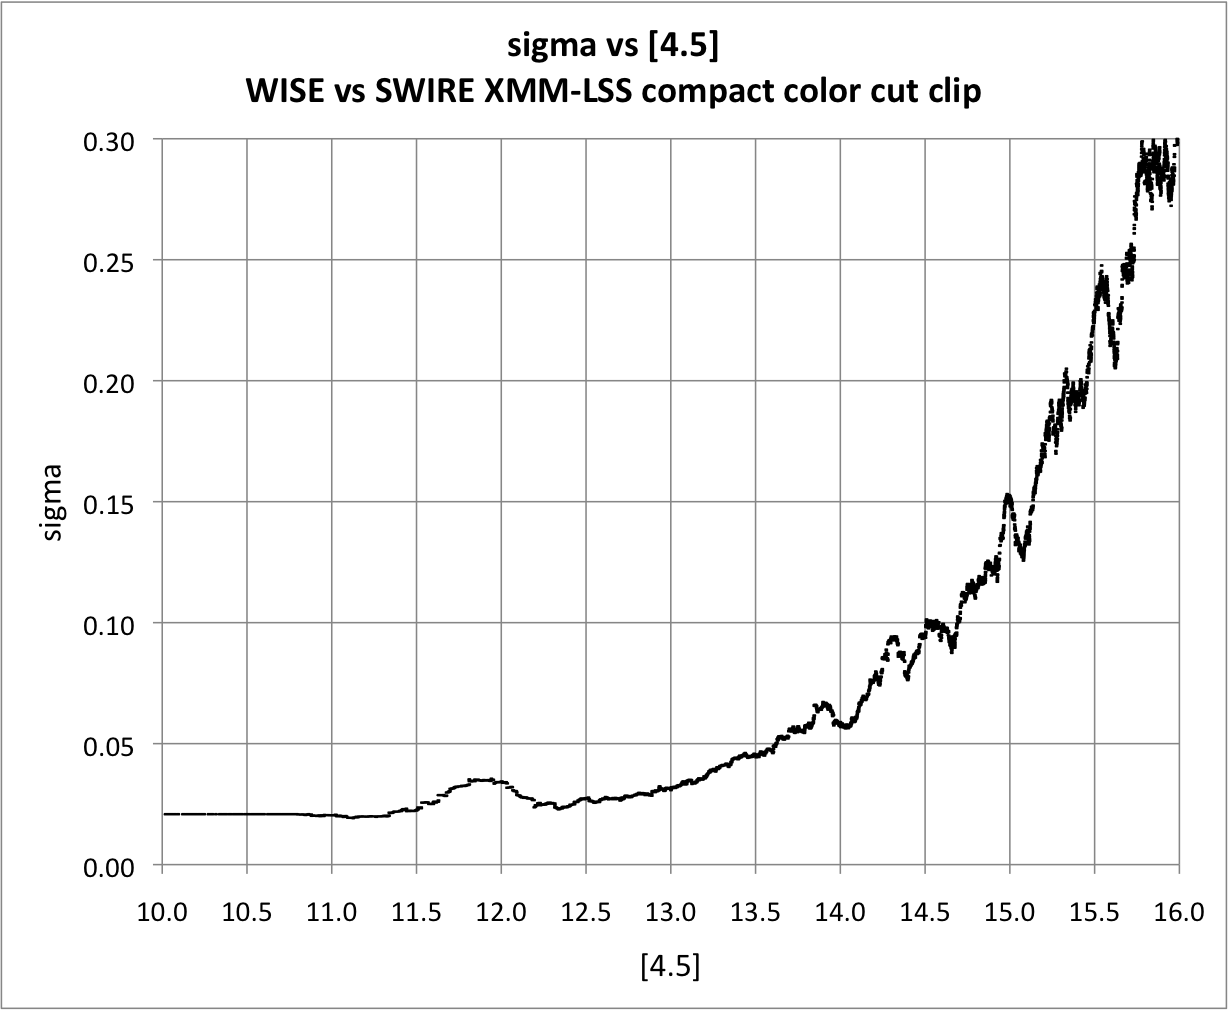 |
| Figure 4 - WISE W2 - SWIRE [4.5] photometry vs. [4.5] in the XMM-LSS field. | Figure 5 - rms W2 - [4.5] error vs [4.5] in the XMM-LSS field. |
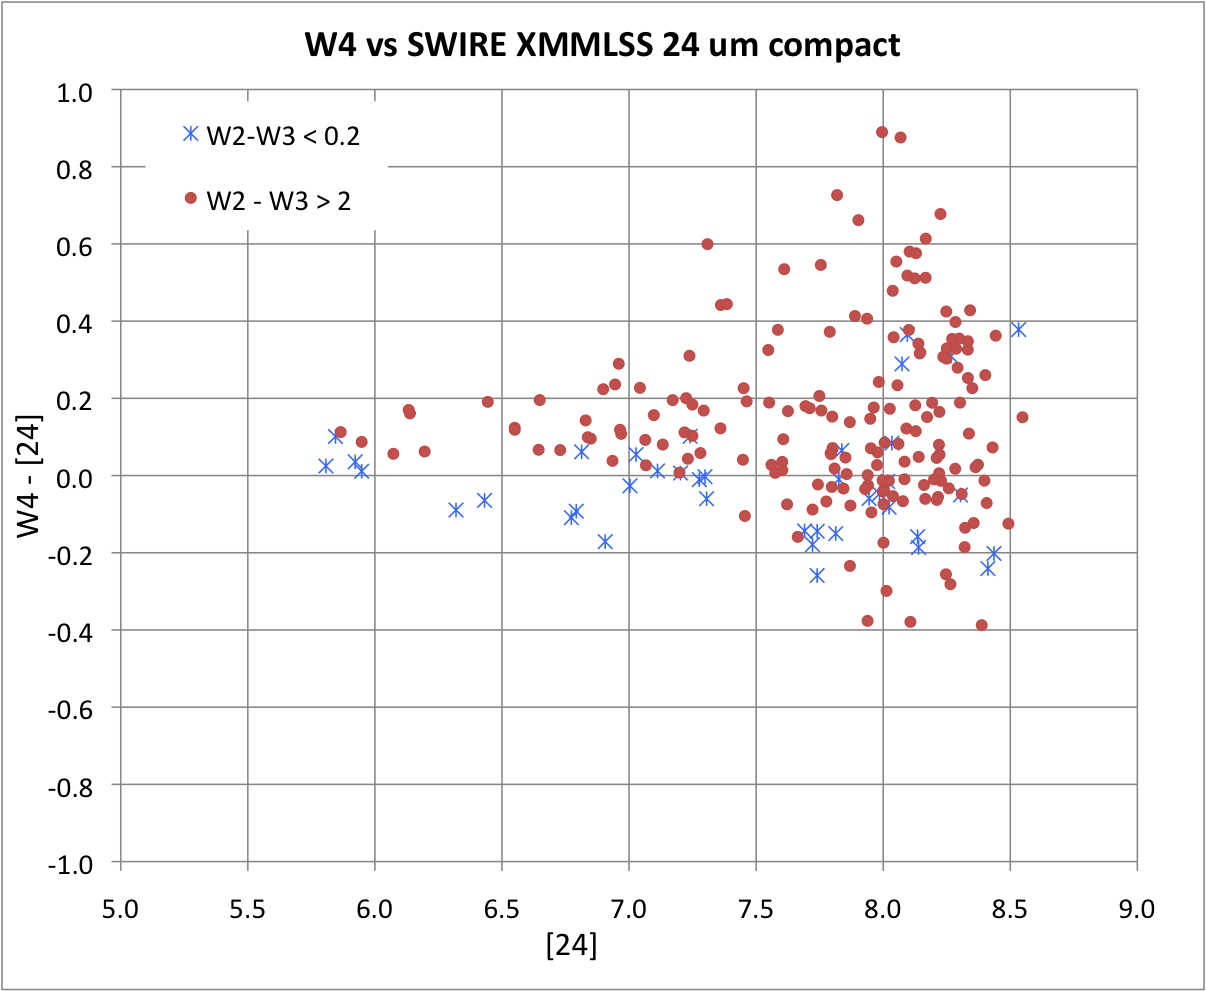
For the W4 to [24] comparison, the SWIRE XMM_LSS Region 24μm Spring '05 Spitzer Catalog was used, with a requirement that the 24 μm flux exceeded 2 mJy, resulting in only 269 SWIRE sources. Of these 215 were matched to the WISE catalog. Figure 6 shows W4 - [24] vs. [24] for these sources. Objects with blue W2 - W3 colors (W2 - W3 < 0.2; plotted blue in Figure 6) are likely stars, and have zero median offset in W4 -[24]. There is a gap in W2-W3 color beyond 0.2: all such sources (plotted red in Figure 6) have W2 - W3 > 2 and are likely galaxies, with a mean W4 -[24] value of 0.12.
 |
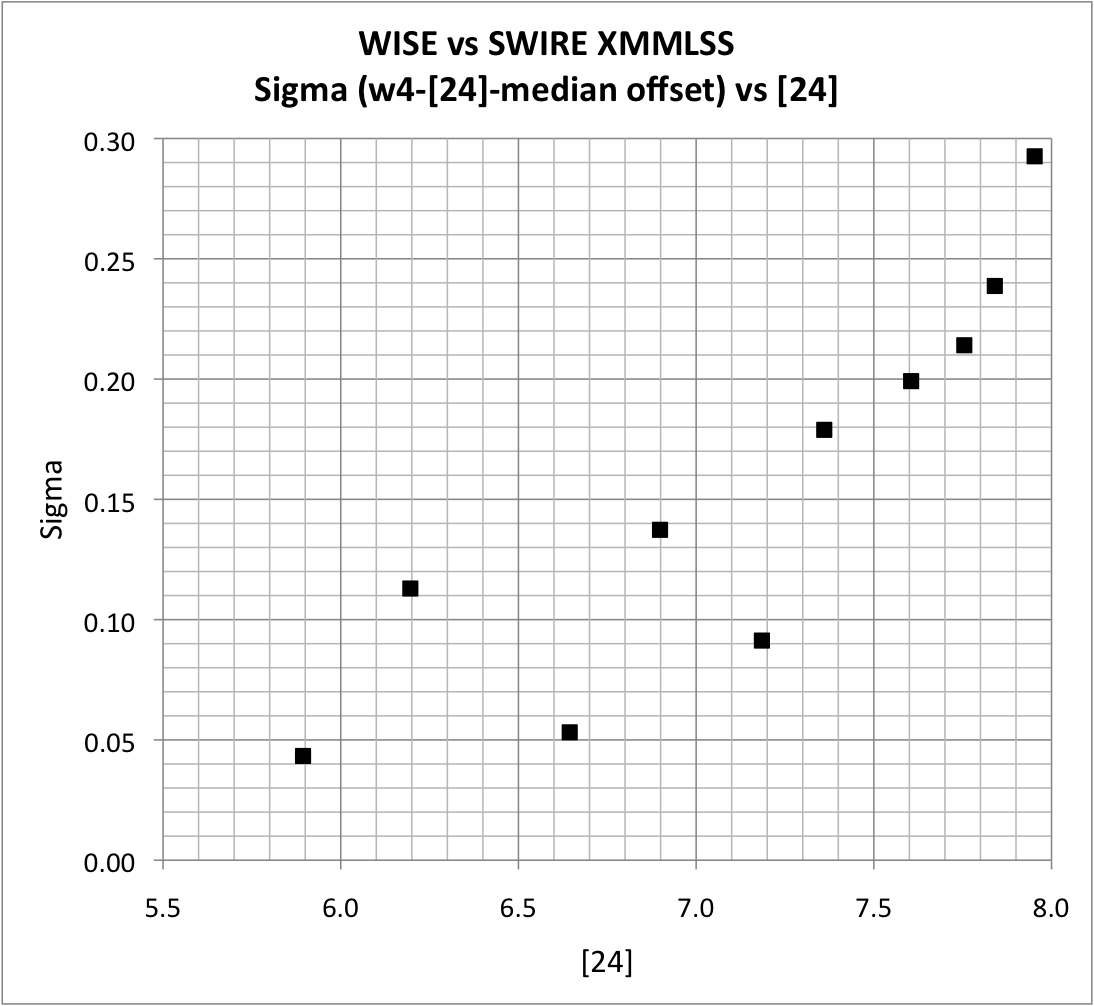 |
| Figure 6 - WISE W4 - SWIRE [24] photometry vs. [24] in the XMM-LSS field. | Figure 7 - rms W4 - [24] error vs [24] in the XMM-LSS field. |
Figure 7 shows the sigma in W4 -[24] vs. [24], which leads to an estimate for SNR 5 of approximately W4=7.9 or 5.9 mJy. A single point in Figure 6 was censored in this rms calculation (the one near W4 -[24] = 0.6 and [24] = 7.3).
In addition, sources were required to have no contamination or confusion in in W1, W2, or W3 (cc_flags = 0 in these bands); no active deblending (na = 0); SNR>10 in W1 and 2 and >2 in W3 (ph_qual at least AAC); small errors in W1 and W2 (w1sigmpro and w2sigmpro<0.03); good PSF fits especially in W3 (rchi2<1.5 and w3rchi2<1.2); to have a Galactic latitude of at least 10° and be at least 30° from the Galactic Center. These constraints yielded a total of 16,816 sources.
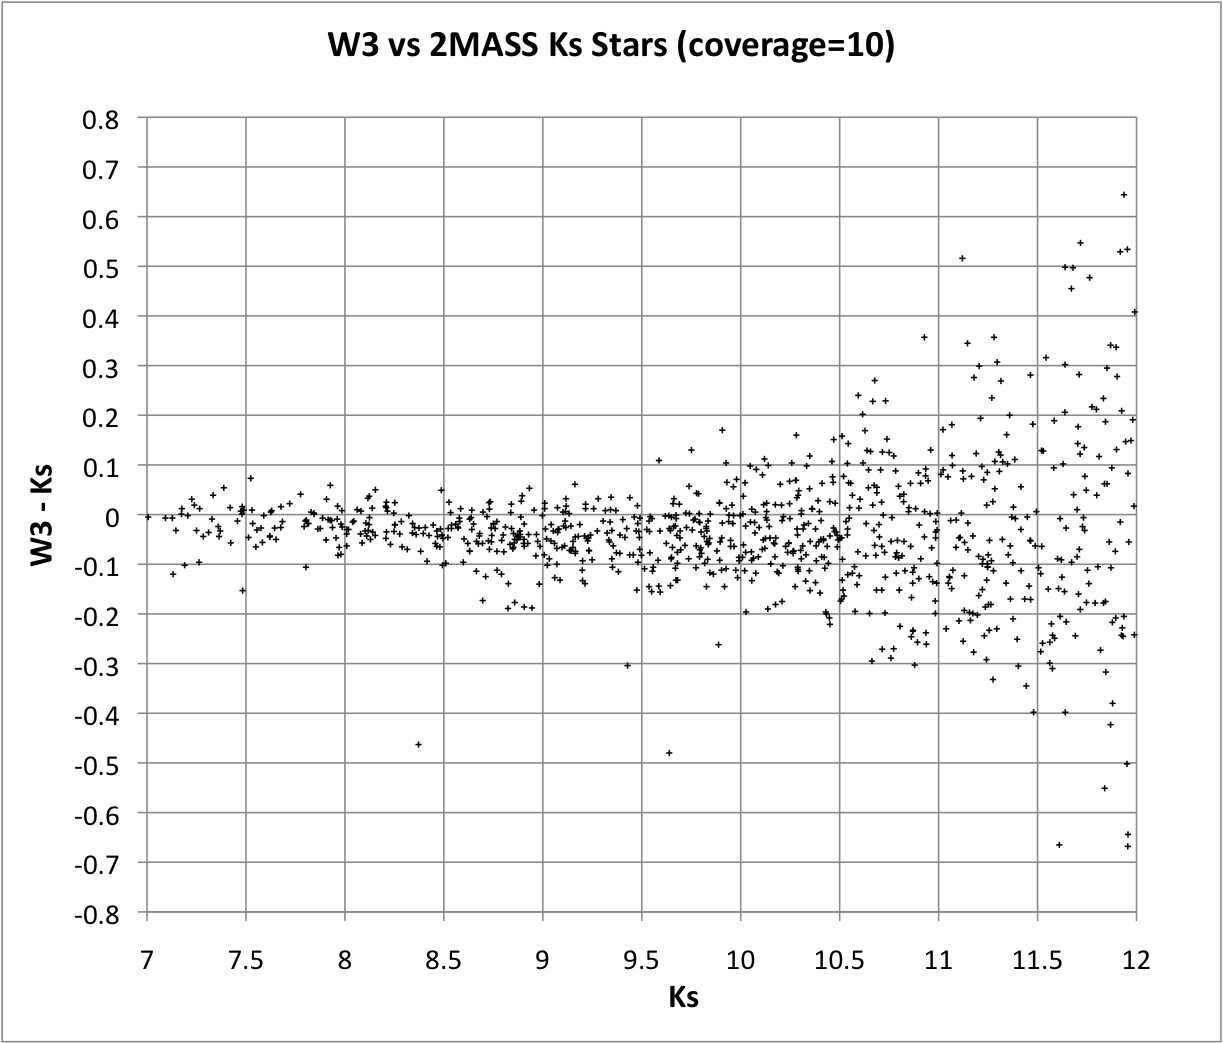
Sources were then sorted by depth of coverage in W3 (w3m). Figure 8 shows a plot of W3 - Ks vs. Ks for the 903 sources with a coverage depth of 10. There is a median offset of W3 - Ks = -0.04 for 8 < Ks < 11. Figure 9 shows the rms in (W3 - Ks + 0.04) vs Ks after excluding 5 sources more than 3σ away from them median, showing that for coverage depth 10, SNR 5 is at approximately 11.5 mag, or a flux of 0.73 mJy in W3.
 |
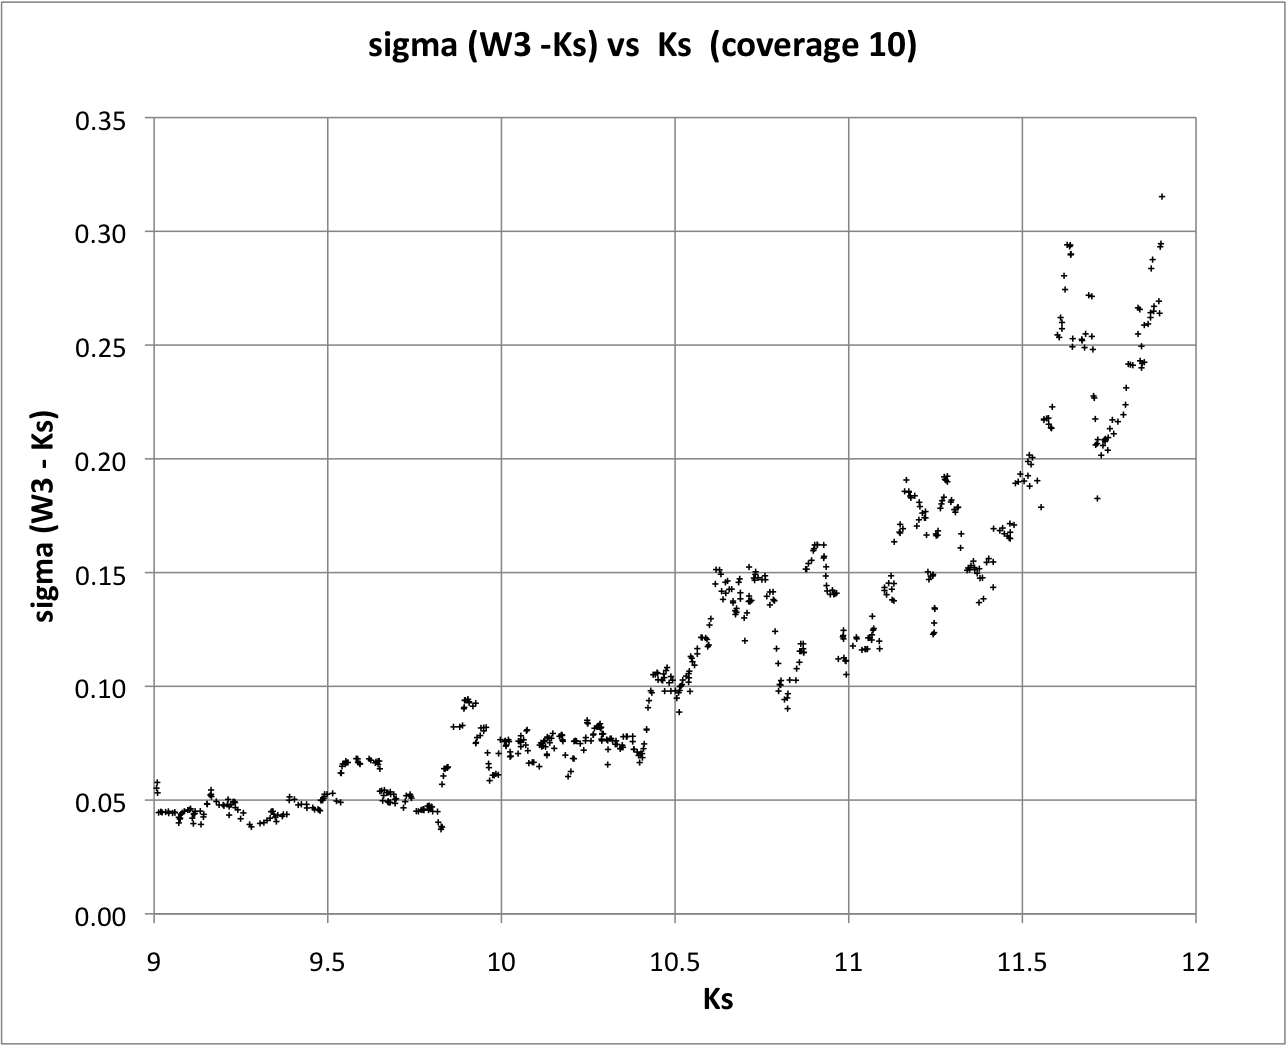 |
| Figure 8 - WISE W3 - 2MASS Ks photometry vs. Ks for W3 coverage depth 10 sources. | Figure 9 - rms W3 - Ks error vs Ks for W3 coverage depth 10 sources. |
The Source Catalog includes the estimated error for every source based on the noise model. Table 1 shows the median W1 (and W2, W3, W4) magnitude for sources with SNR 5 (i.e. (w1sigmpro (and w2sigmpro, w3sigmpro, w4sigmpro) = 0.217 in the XMM-LSS Image Atlas tile which are not extended (ext_flg = 0 and xscprox is null) and have cc_flags = 0 in the relevant band. The values are similar to those found from the external checks, but generally 20% fainter. They are also similar to the values found from the rms in repeated WISE measurements of the same source as reported in Wright et al 2010. The repeatability measurements do not include the impact of confusion because the error due to flux from unresolved sources is the same for the repeated WISE measurements. The external checks use photometry from higher resolution data and should therefore include confusion noise. Although the noise model should include contributions from confusion noise because of the fluctuations in the background caused by unresolved sources, the fact that the noise model values are closer to the repeatability measurements than to the external checks suggests that confusion noise may not be fully captured by the model.
The Preliminary Release Catalog includes sources with SNR >7 based on the noise model. To provide users with a sense of how the Source Catalog sensitivity varies over the Preliminary Release, the same procedure described for the XMM-LSS tile was carried for sources with SNR 7 (i.e. w1sigmpro etc. = 0.155) in every tile in the Preliminary Release which had enough sources satisfying the constraints to provide a meaningful estimate in the appropriate WISE band. The results are shown graphically in Figure 1.
Last update: 2011 April 12