III. NEOWISE Single-exposure Images
III.2. Cautionary Notes
III.2.c. Image Anomalies and Features
Many of the single-exposure image anomalies seen in the Post-Cryo Data Release (section VIII.2.b.i) are also seen in the NEOWISE Reactivation
images. On this page we discuss anomalies that have not been noted before
or ones that are not new but are rare.
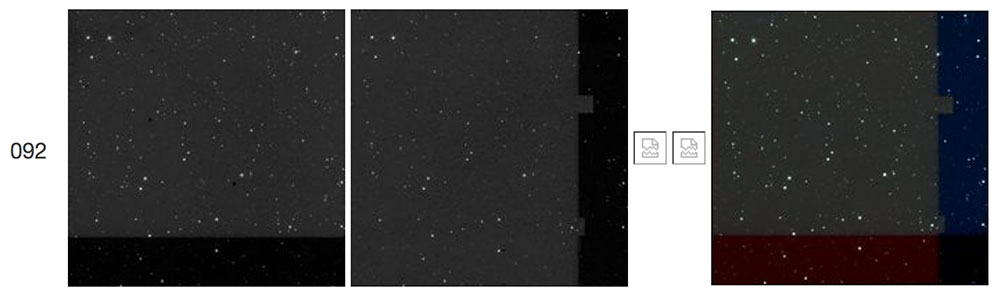
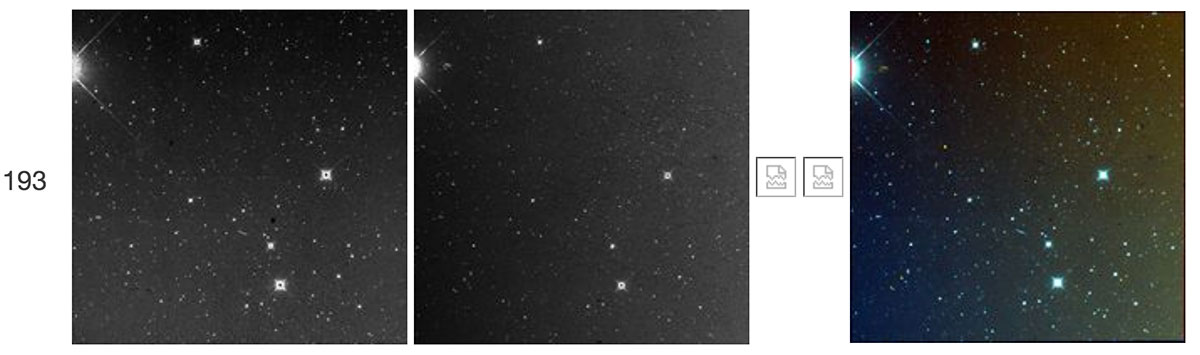
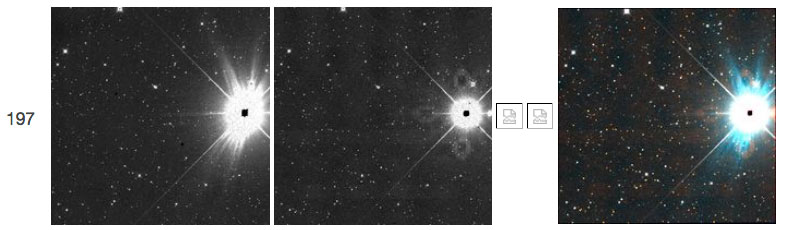
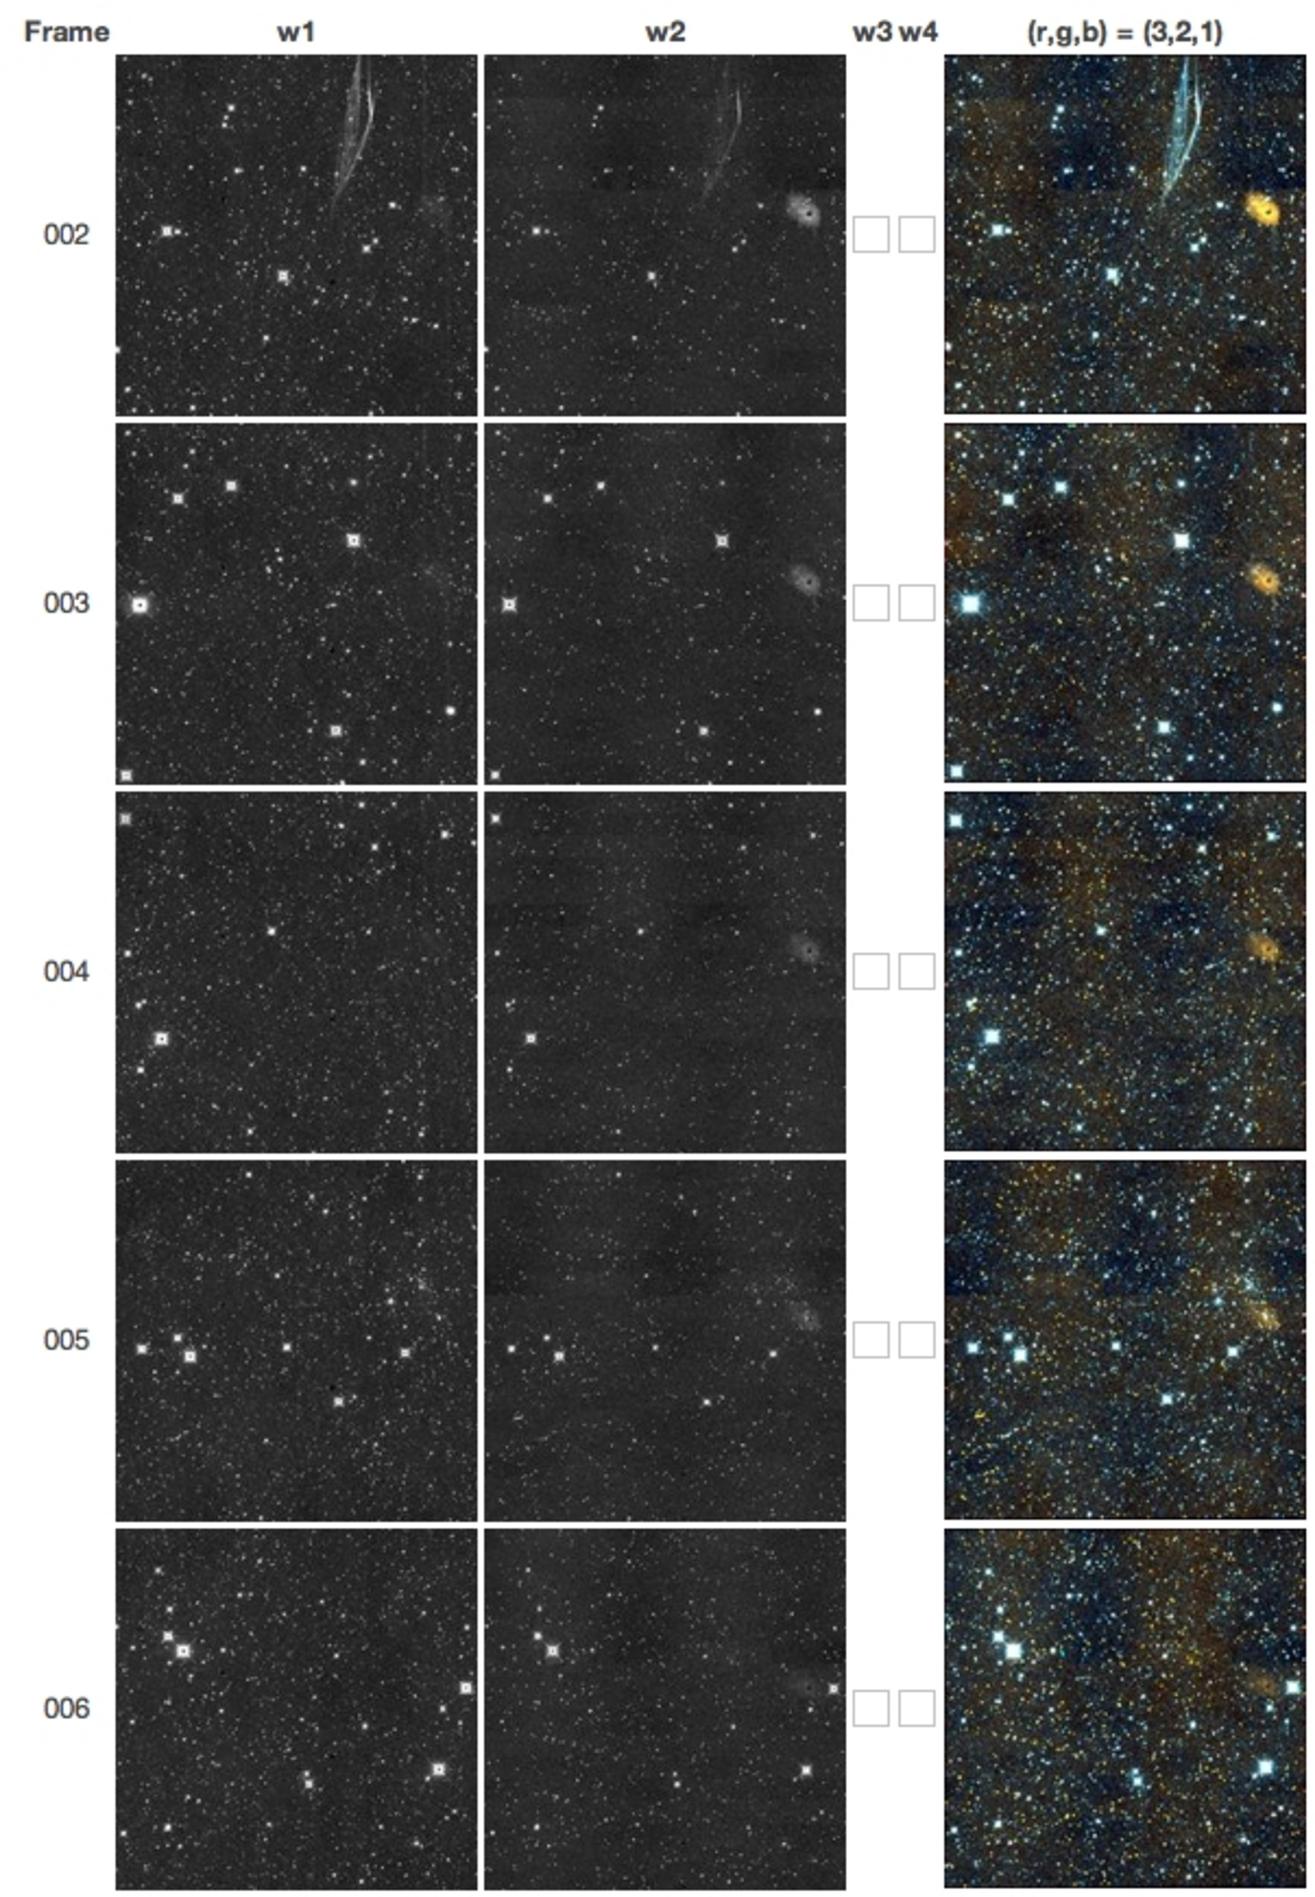
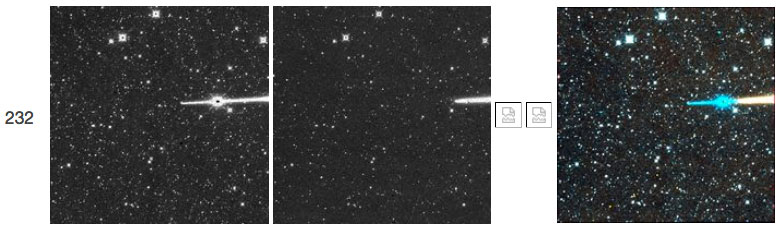
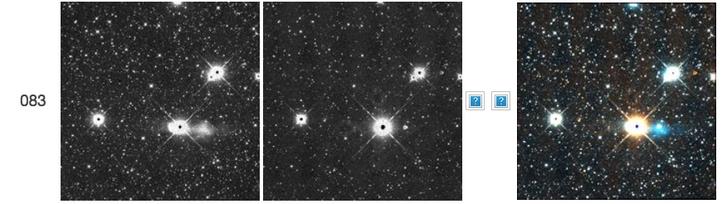
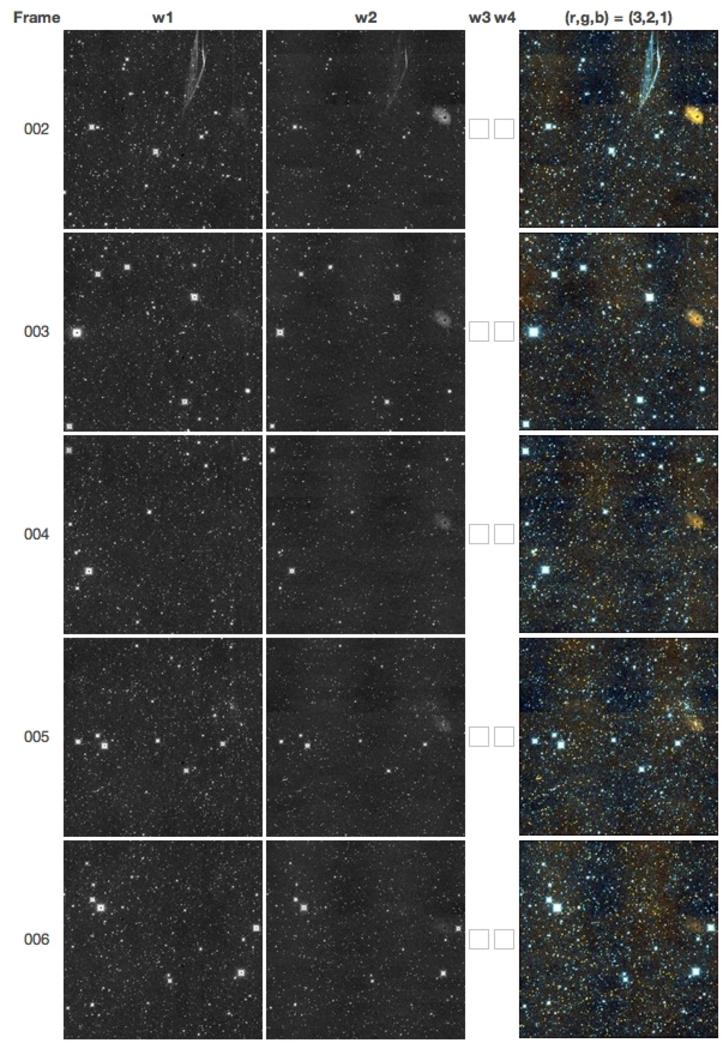
Each figure below shows one row of images per frameset. Each image is
47x47 arcminutes square. From left to right are shown the full
single-exposure frame for W1, W2, broken icons for bands W3 and W4
(because these two bands were not active during the NEOWISE mission) and
a three-color image comprised of blue (W1 only) + green (an average of
W1 and W2) + red (W2 only). The frameset number is shown at far left.
Click on the thumbnails to see the images at higher resolution. Readers
are encouraged to preview these same images using the WISE image service
at IRSA and to download the FITS files for further study. To aid the
reader, values of the frame_ID are provided in the caption of each
figure.
Image examples below are divided into the following categories:
Electronic effects:
"Resonant" (a.k.a. "exploding") pixel effect in W2
Increased partial channel noise
Unusual cosmic ray effects
Latents from unusual sources
Effects from bright objects:
Dark rectangular region in W1, in presence of off-array source
Glints from point sources
Smeared latents from source images smeared by spacecraft maneuvers
Satellite flashes, tumbling satellites, and orbital debris
Electronic effects:
The effects discussed here are similar to ones seen in the Post-Cryo
data but either show different features or are sufficiently rare and
unusual that a reminder here is prudent. Additional details on these
artifacts can be seen in section VIII.2.b.i of the All-Sky Explanatory Supplement.
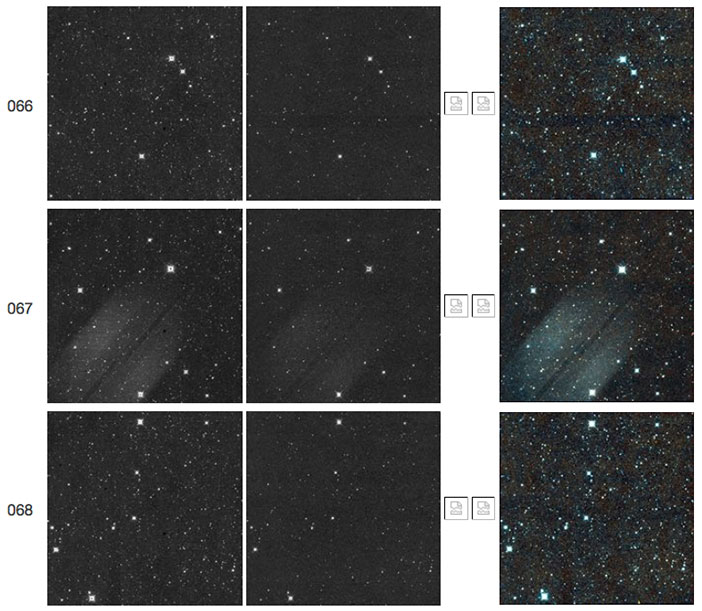
Electronic effects: "Resonant" (a.k.a. "exploding") pixel effect in W2
 |
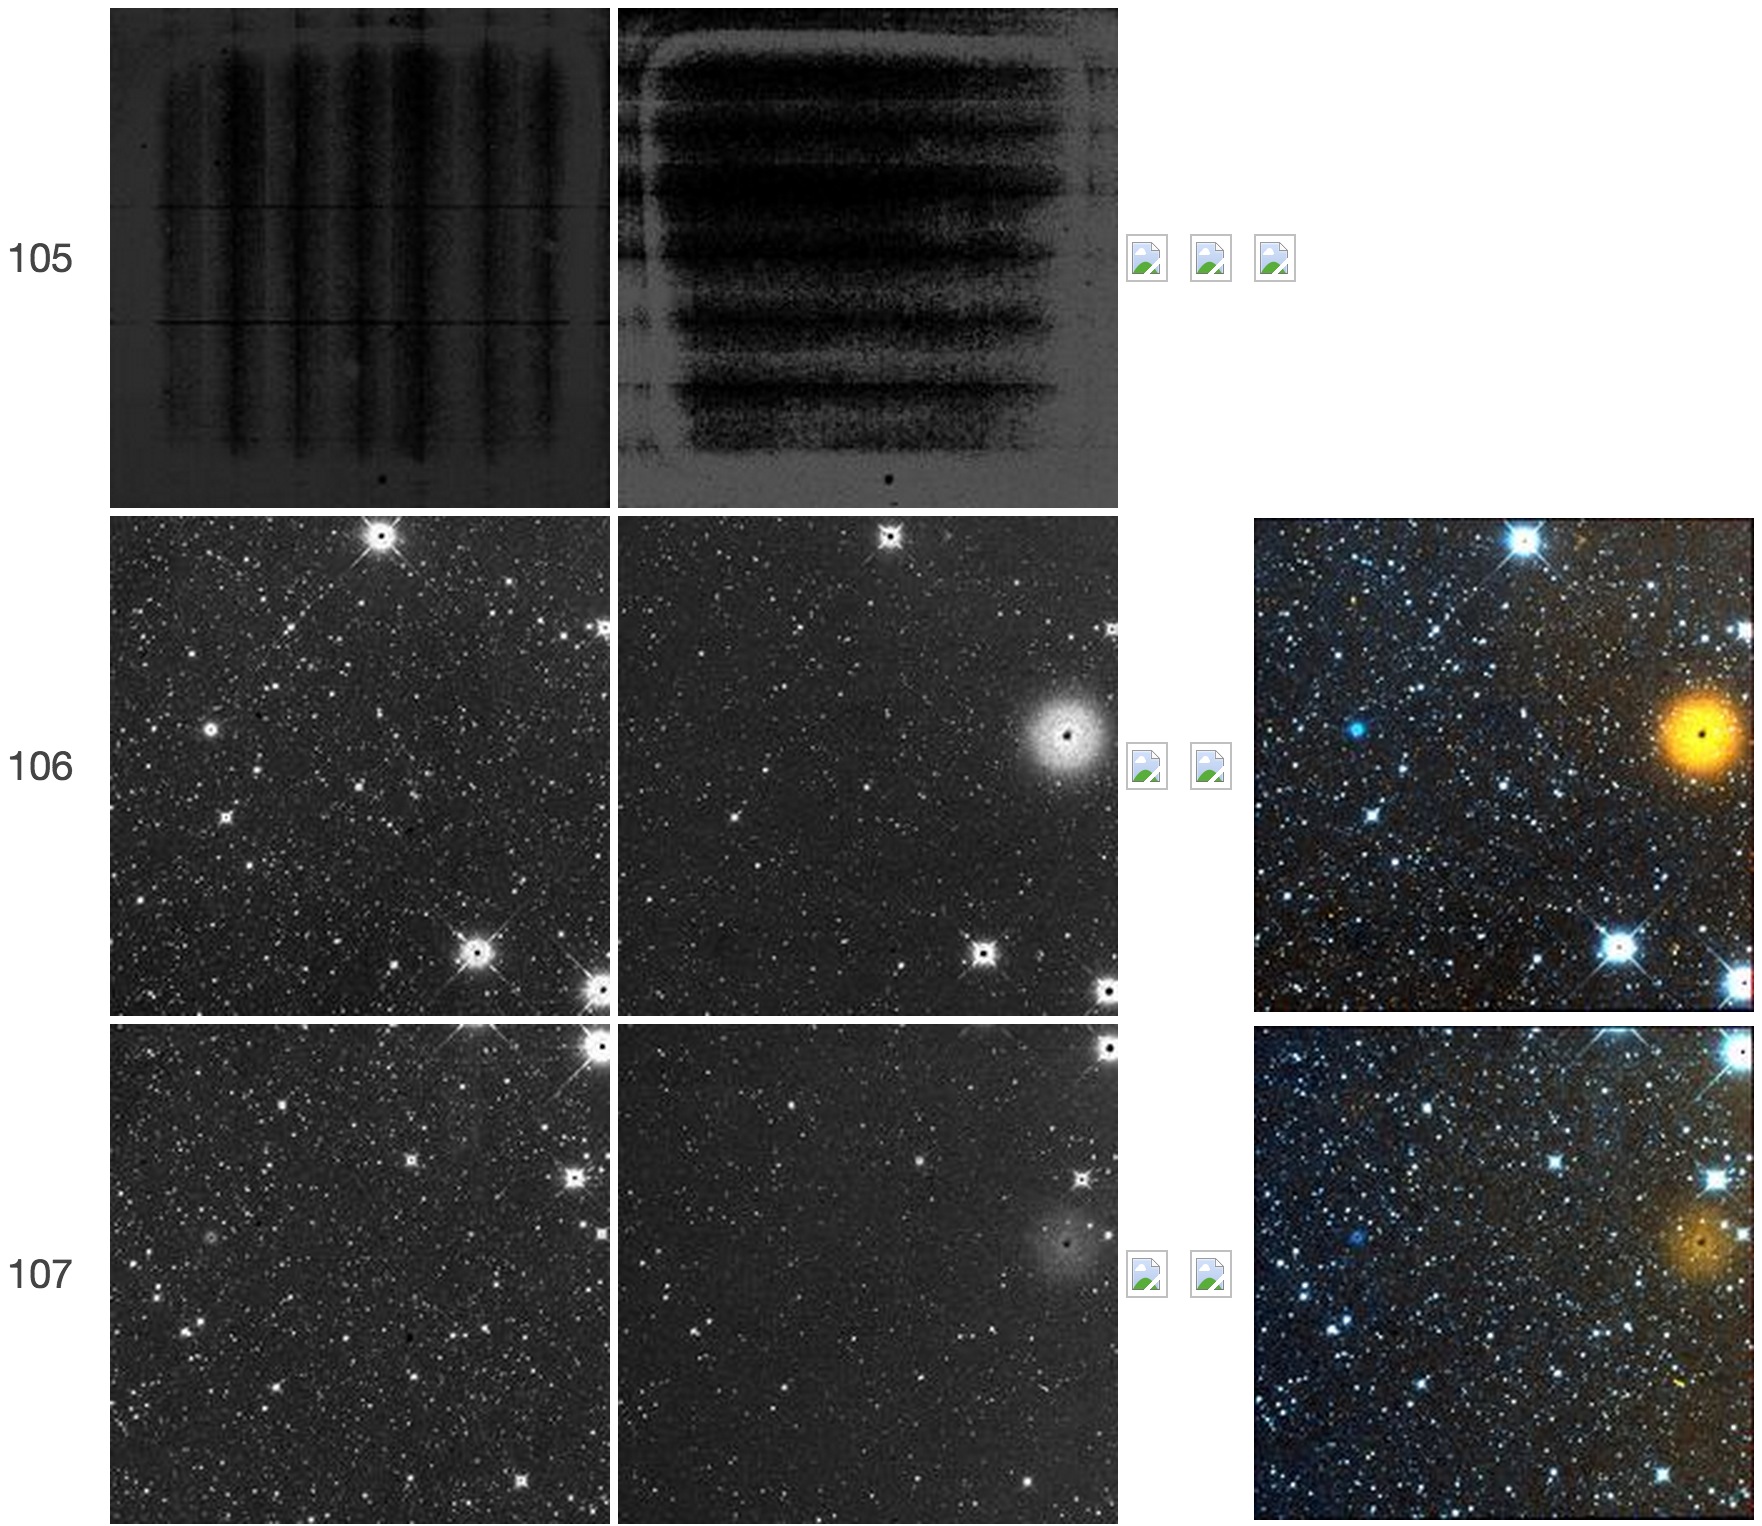
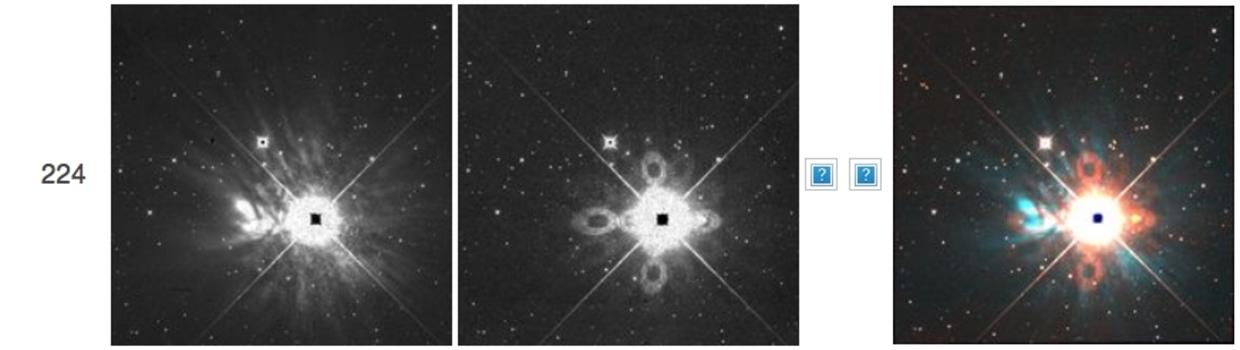
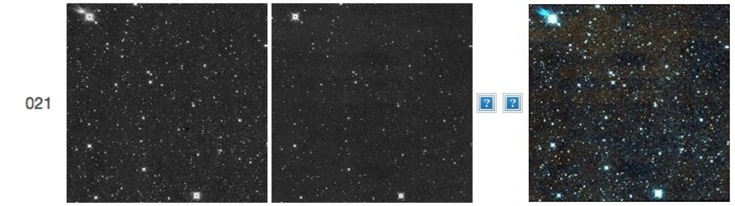
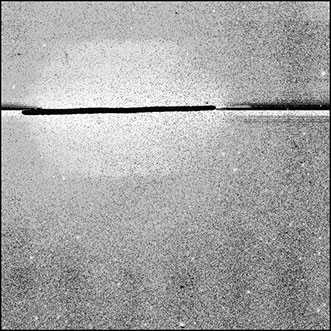
| Figure 1 - Single-exposure framesets 48672a105-107. This is a rare anomaly described in section III.2.c.ii.
Frameset 105 has high backgrounds and an unusual illumination pattern.
This frameset also failed to complete processing, so its color-composite
image is not available. Subsequent frames show an area on the
W2 array where a transient event slowly decays. The pixel at the center
of this "latent" is approximately the same as that
in the other known examples listed in section III.2.c.ii.
|
Electronic effects: Increased partial channel noise
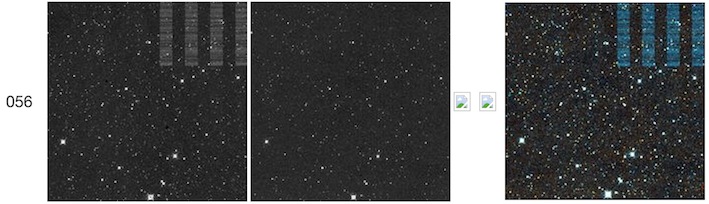 |
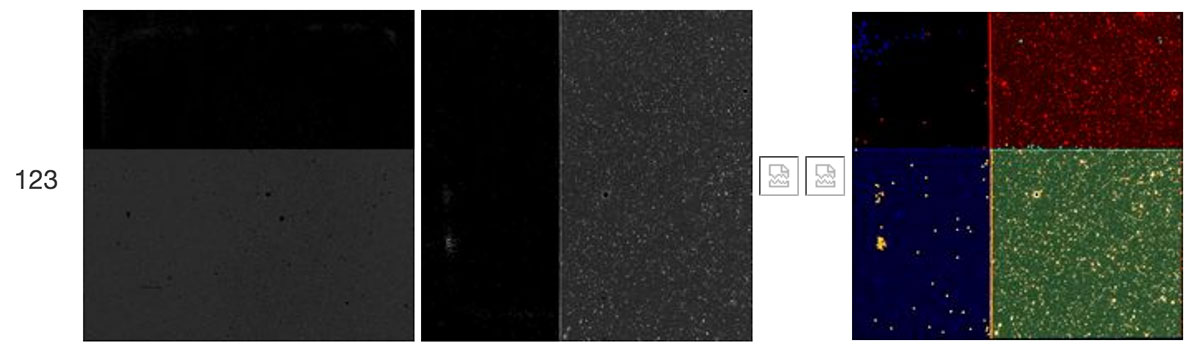
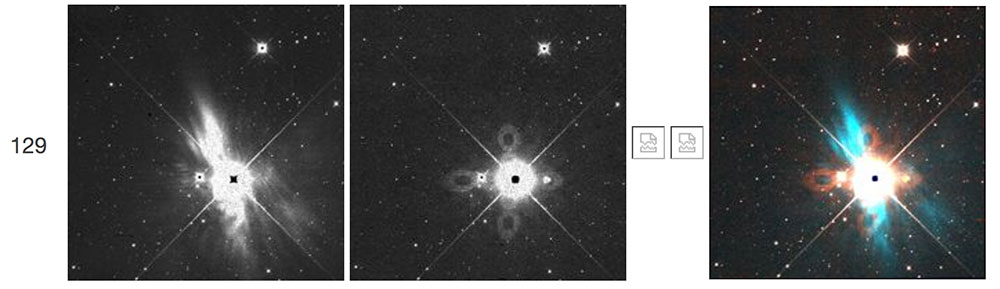
| Figure 2 - Single-exposure frameset 55122a056. Increased backgrounds and
noise are seen in portions of four W1 readout channels; these channels run vertically the entire height of the chip.
Having only a portion of the channel demonstrates this effect is new to the NEOWISE Reactivation data. |
Electronic effects: Column of NaNs
 |
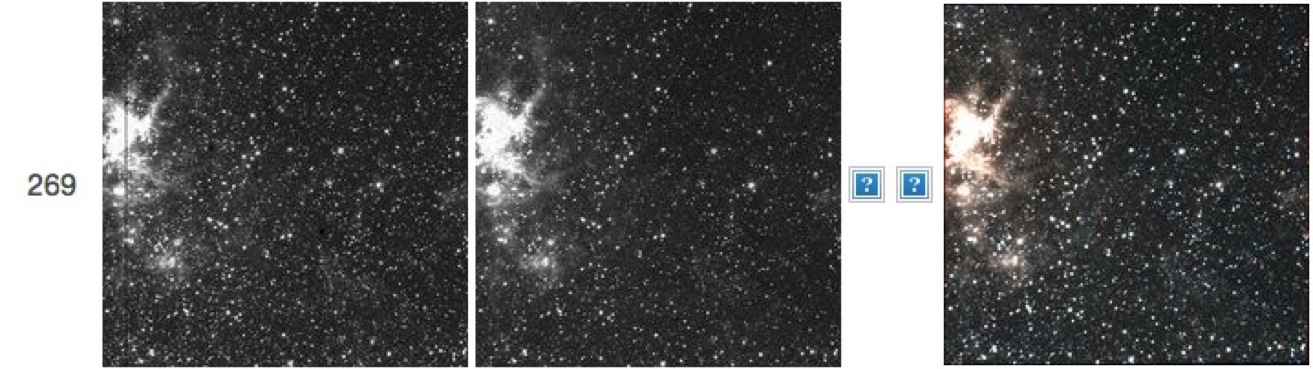
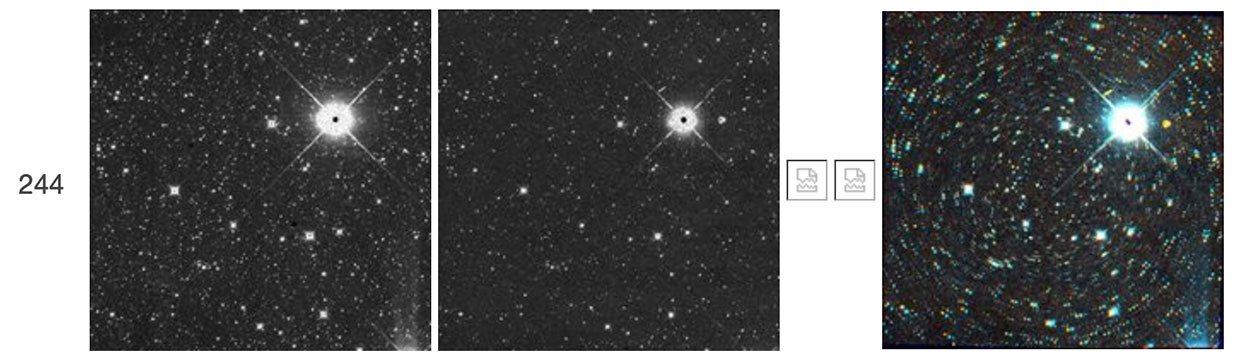
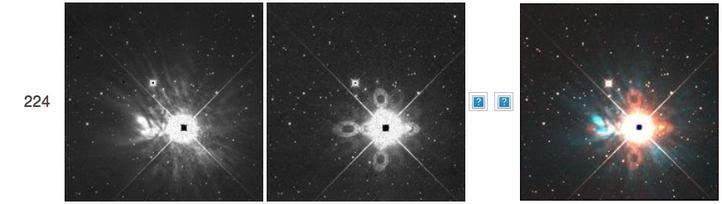
| Figure 3 - Single-exposure frameset 65288a269. In the
presence of very bright, saturating sources, in the left side of
frames, a column of NaNs is created in W1 only. The Tarantula nebula
illustrates this case. The location of this
column is not constant among various instances. Another such instance is in
frameset 66982a023 (not shown), which contains R Dor. |
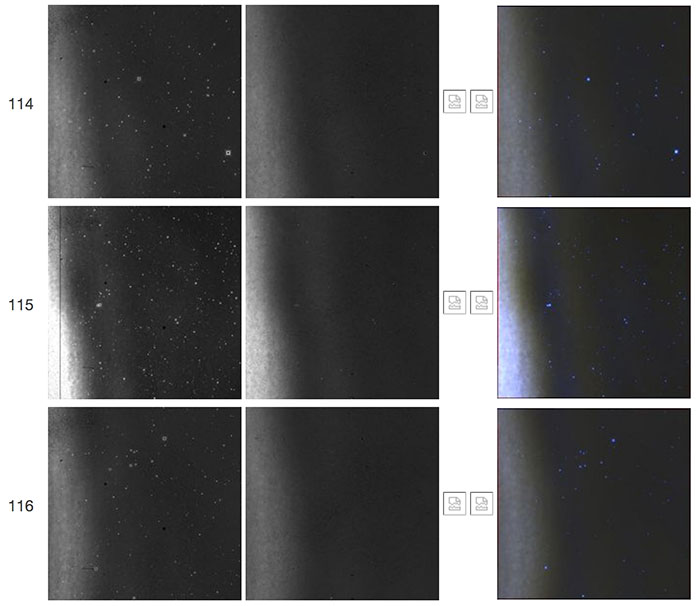 |
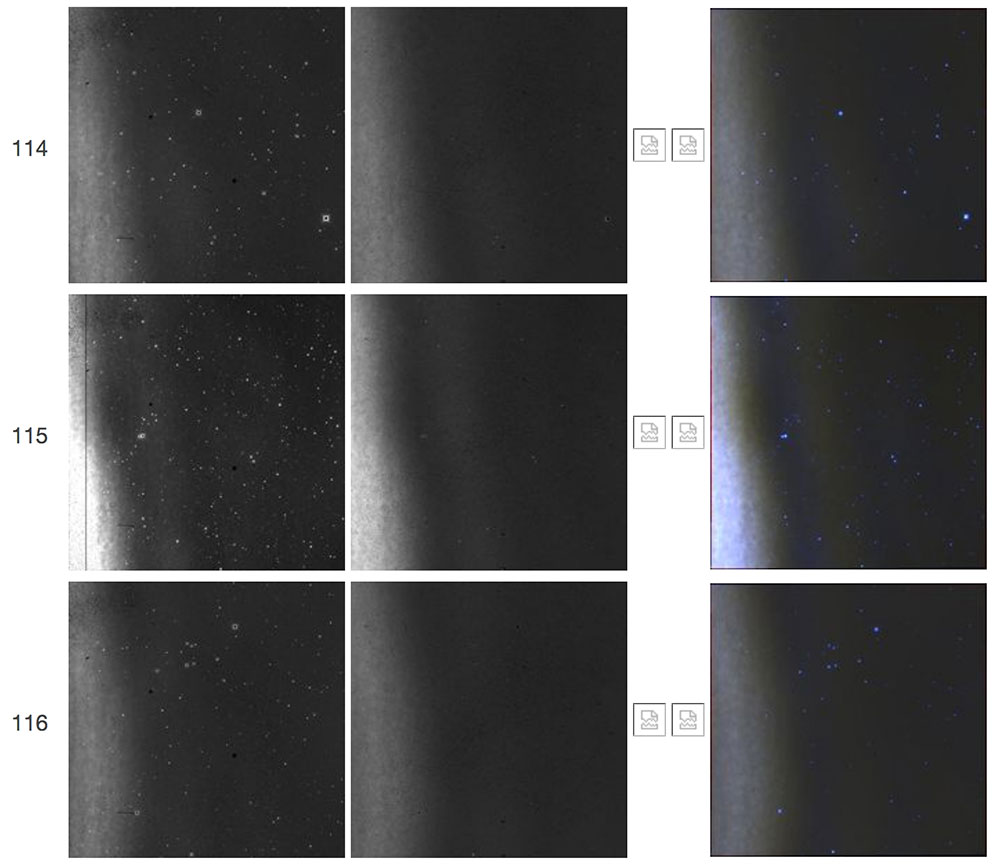
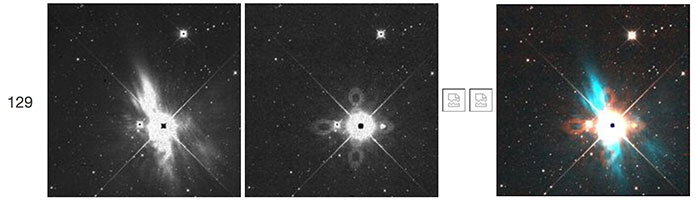
| Figure 3a - Single-exposure frameset 97712a115.
Another instance of a column of NaNs in W1 created in the
presence of very bright, saturating sources, in the left side of
frames. Bright Moon glow illustrates this case. |
 |
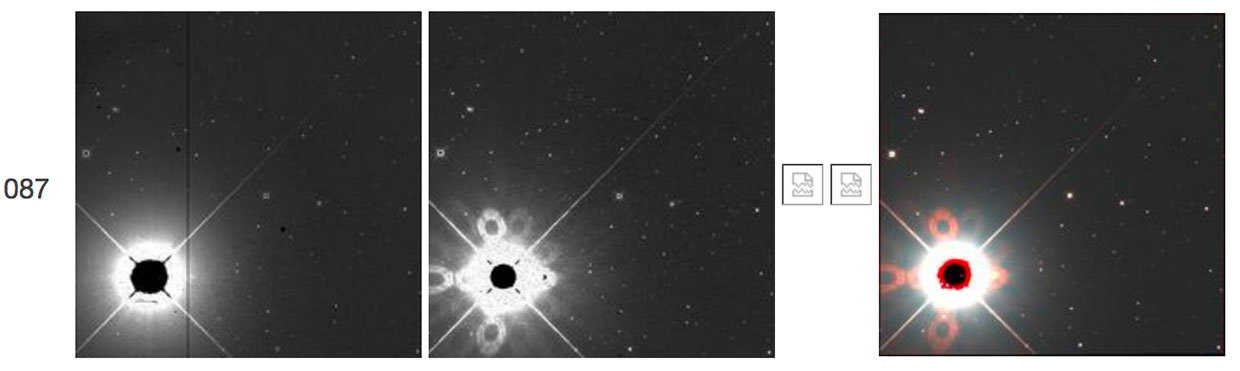
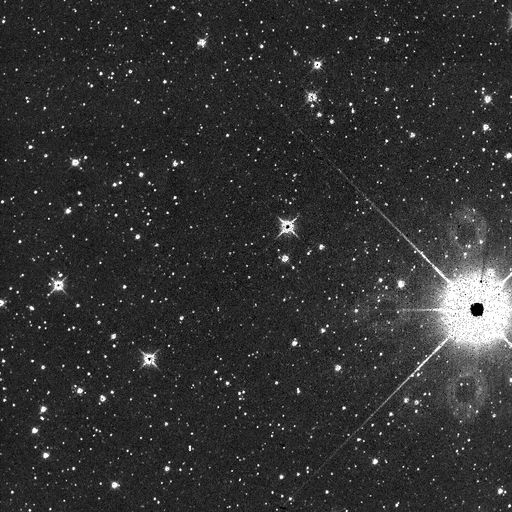
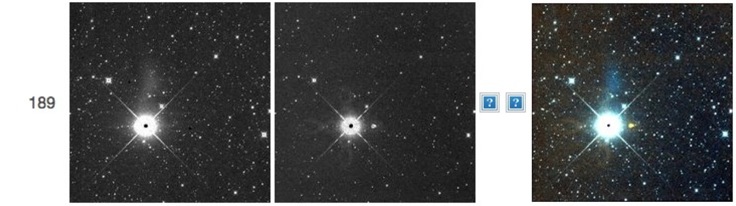
| Figure 3b - Single-exposure frameset 03389r087.
This is another instance of a column of NaNs in W1, created in this case by the
presence of the very bright, saturating star Betelgeuse. This column of NaNs is
closer to the center of the array than other examples above. |
Electronic effects: "TV test patterns"
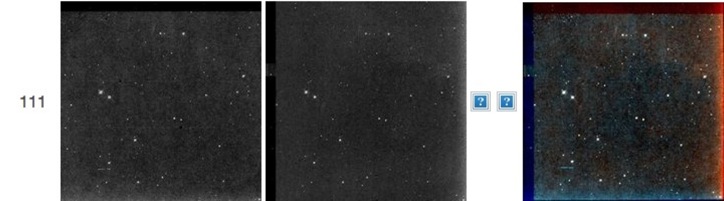 |
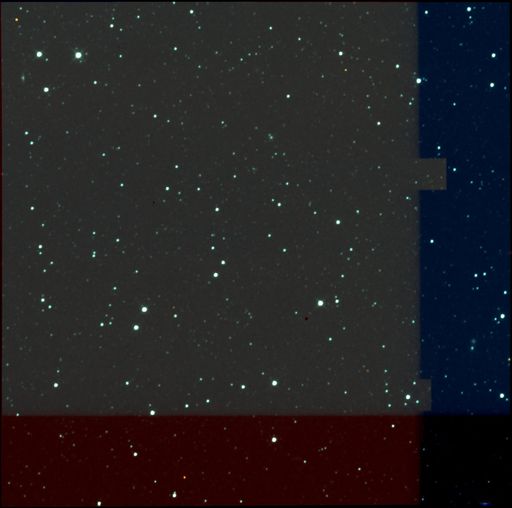
| Figure 4 - Single-exposure frameset 65354a111. On rare
occasions, areas of the array show lower backgrounds than surrounding
regions, the case for which is unknown. This phenomenon has been seen
before (see section II.4.b.ii of the All-Sky Explanatory Supplement). The affected W1 and W2 areas,
on the top and left of the respective arrays, run orthogonal to
the read-out channels. The images also show a diffuse glow in regions along
the right and bottom edges. |
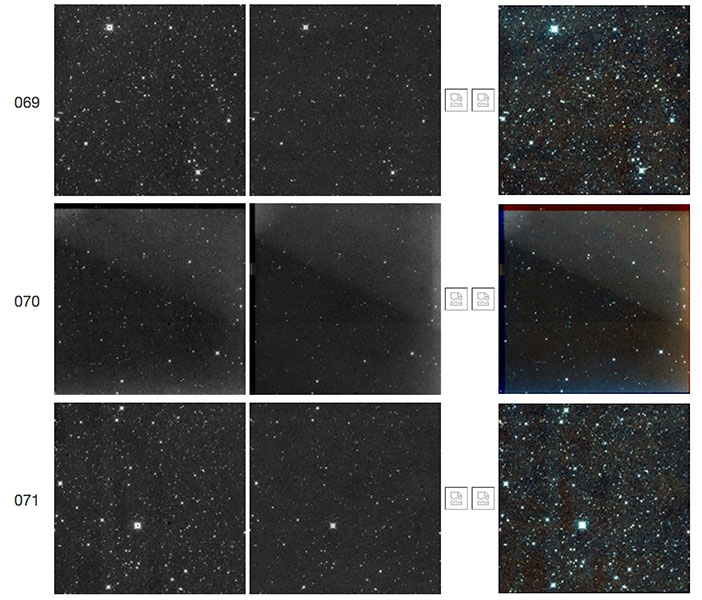 |
| Figure 4a - Single-exposure framesets
24937r069-071.
Frameset 070 illustrates another case in which some areas of the array
show lower backgrounds than surrounding regions. This example shows
affected W1 and
W2 areas on the top and left of their respective arrays, running
orthogonal to the read-out channels. The images also show a diffuse
glow in regions along the right and bottom edges. Multiple diagonal
features
in W1 and W2 run across the arrays, as well as a subtle signal jump in
W2
near the middle of the array.
|
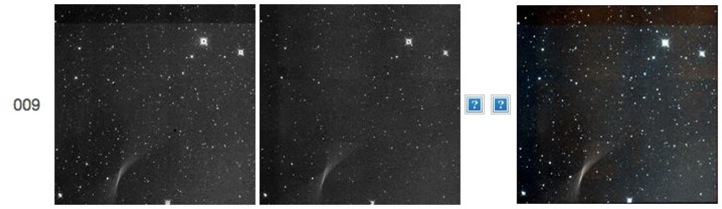 |
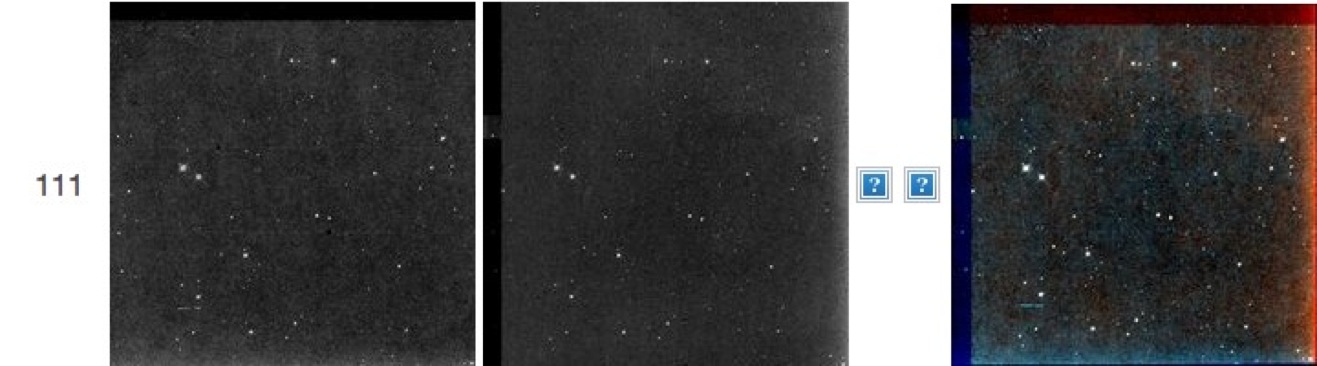
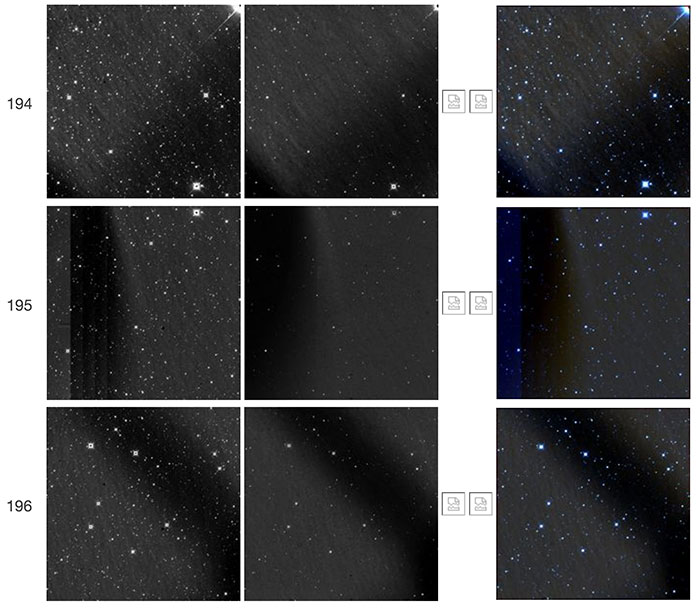
| Figure 5 - Single-exposure frameset 65477a009.
Another instance of areas of the array showing lower backgrounds than
surrounding regions. This example also shows affected W1 and
W2 areas on the top and left of their respective arrays, running orthogonal to the
read-out channels. The images also show a strange glint, or a
feature from a nearby fly-by. |
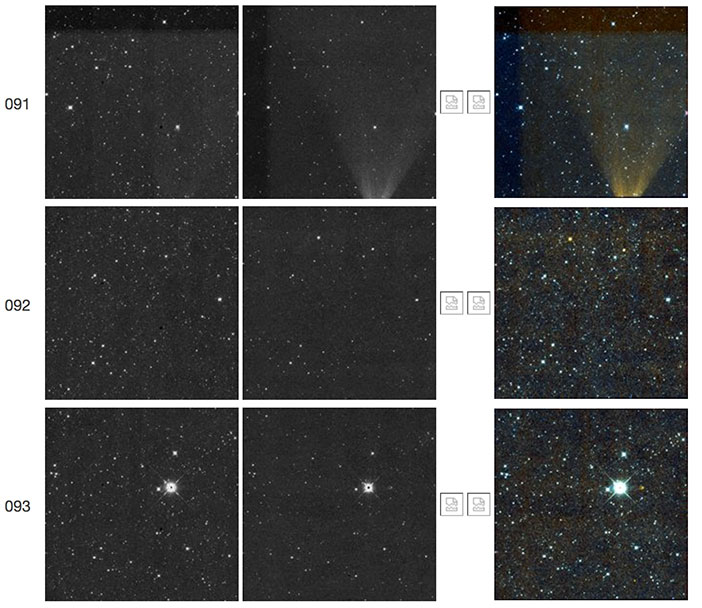 |
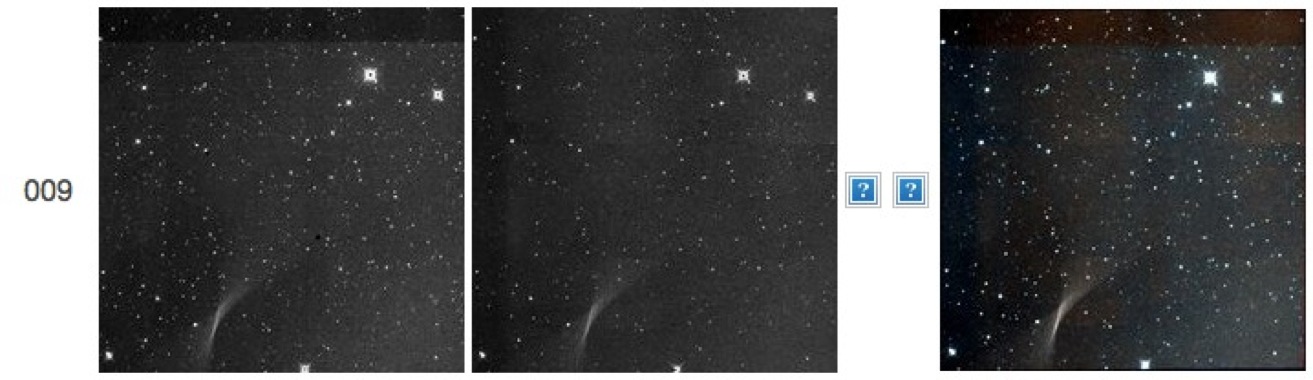
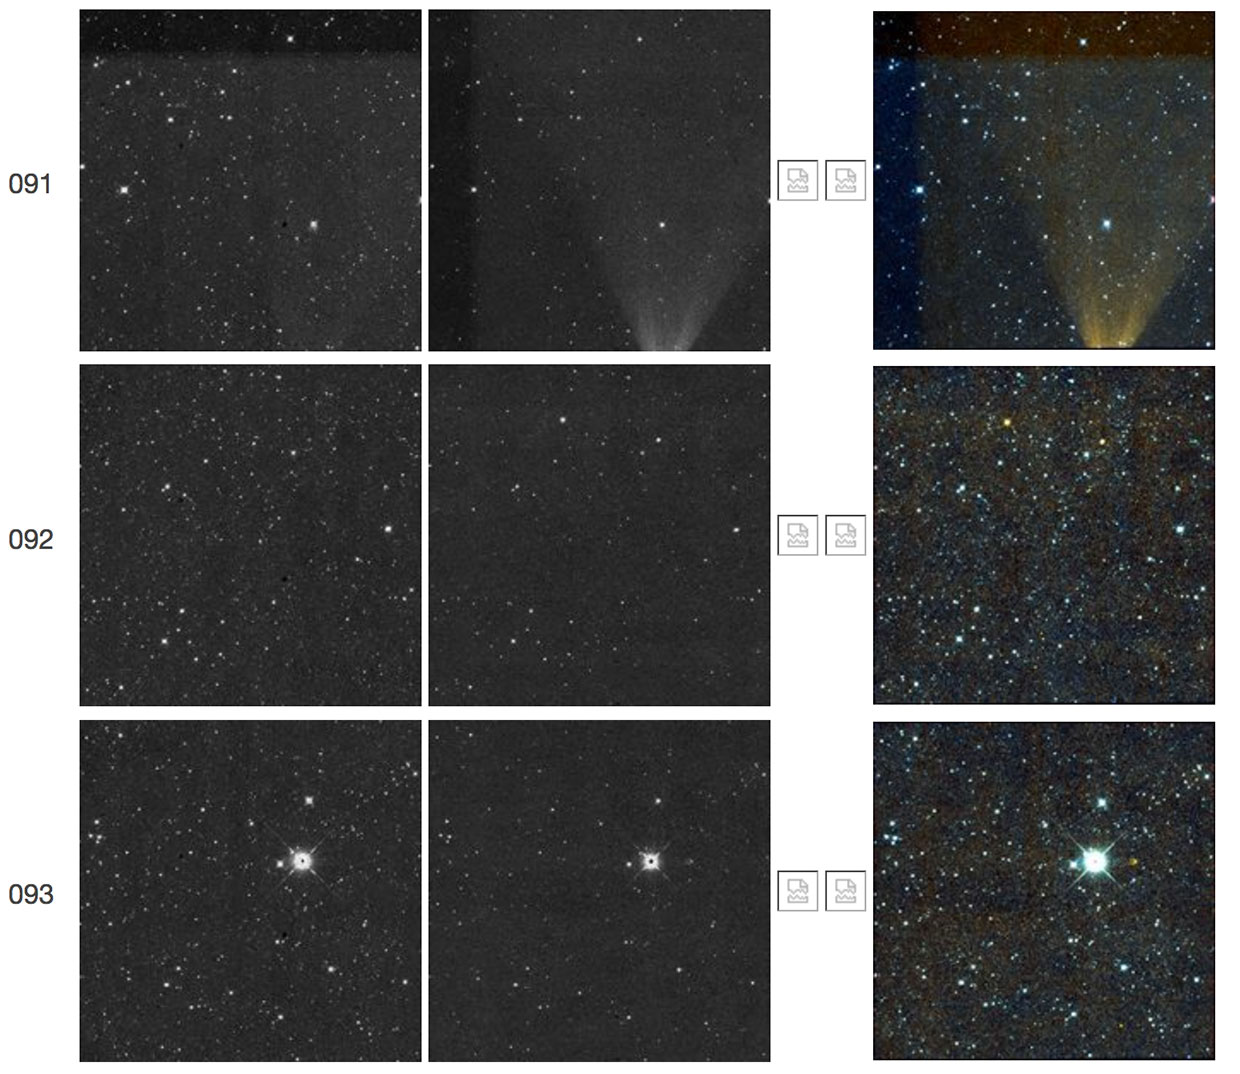
| Figure 5a - Single-exposure framesets 33764r091-093.
Frameset 091 illustrates another instance of areas of the array showing
lower backgrounds than surrounding regions. The affected W1 and W2 areas
are on the top and left of their respective arrays,
running orthogonal to the read-out channels. The images in 091 also show
a strange fan-like glint, primarily in W2, likely to be a feature from an
off-frame fly-by during this exposure. |
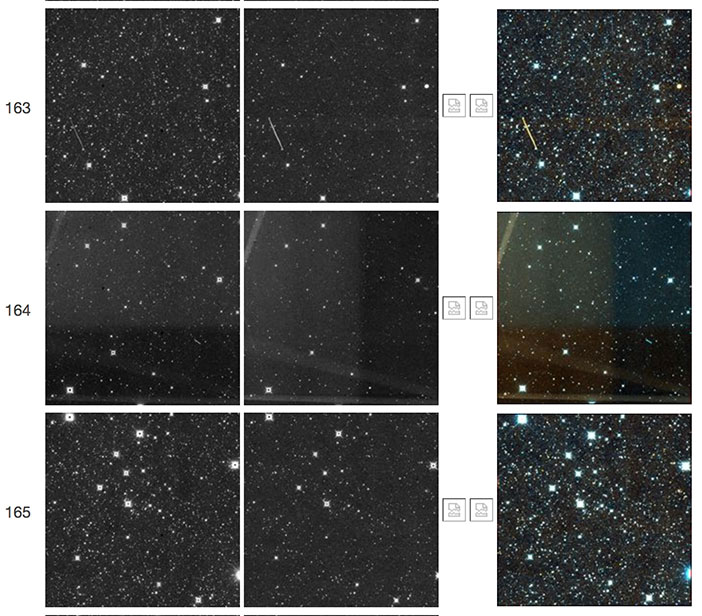 |
| Figure 5b - Single-exposure framesets 24496r163-165.
Frameset 164 illustrates another instance of areas of the array showing lower backgrounds than
surrounding regions. The affected W1 and
W2 areas are on the bottom and right of their respective arrays, running
orthogonal to the read-out channels. The images in 164 also show a
satellite trail at the upper left corner, a band perpendicular to the
trail running across the arrays, and a nearly horizontal band near the
bottom of the arrays. The cause for these two bands is unknown.
|
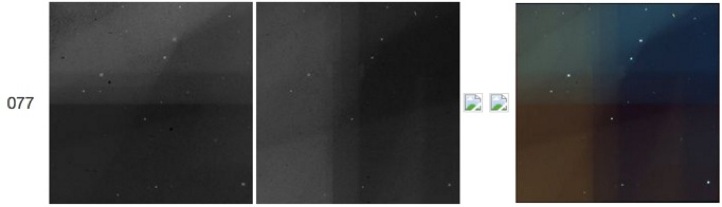 |
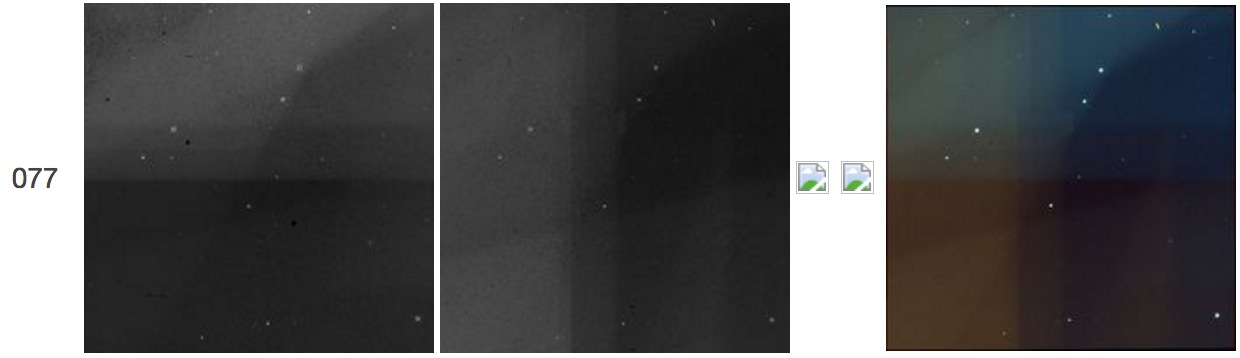
| Figure 6 - Single-exposure frameset 66085a077.
Instance of areas of the array showing higher level backgrounds than
surrounding regions. This is the typical bright "test pattern"
(see section II.4.b.ii of the All-Sky Explanatory Supplement).
The images also show a diagonal swath or glow, possibly indicative of a
fly-by. |
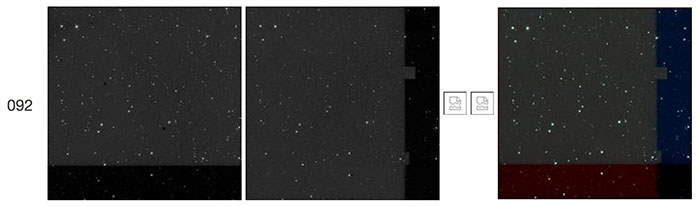 |
| Figure 6a - Single-exposure frameset 93514a092.
Another instance of areas of the array showing lower backgrounds than
surrounding regions. The affected W1 and W2 areas, on the bottom and
right of the respective arrays, run orthogonal to the read-out channels.
The W2 array also exhibits two small notches of higher backgrounds that
protrude into the rectangular area of lower backgrounds. A detailed
view is shown below. A hint of this phenomenon is also seen in Figure 4. |
 |
| Figure 6b - Single-exposure frameset 93514a092.
This is
a zoomed-in version of the "TV test pattern" in Figure 6a showing the
small notches of high backgrounds that protrude into the lower
background rectangle in W2. |
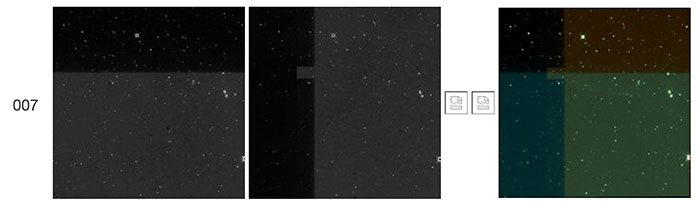 |
| Figure 6c - Single-exposure frameset 99043a007.
Another instance of areas of the array showing lower backgrounds than
surrounding regions. The affected W1 and W2 areas, on the top and left
of the respective arrays, run orthogonal to the read-out channels. The
W2 array also exhibits a small notch of higher background that protrudes
into the rectangular area of lower background. A detailed view is shown
below. This phenomenon is also seen in Figures 4, 6a, and 6b. |
 |
| Figure 6d - Single-exposure frameset 99043a007.
This is
a zoomed-in version of the "TV test pattern" in Figure 6c showing the
small notch of high background that protrudes into the lower background
rectangle in W2. |
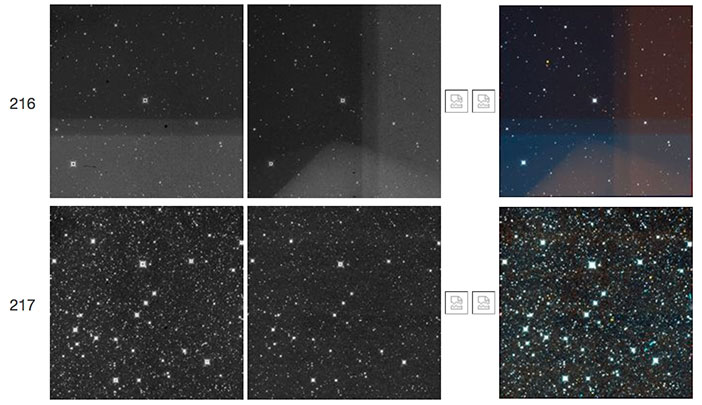 |
| Figure 6e - Single-exposure frameset 03544r216.
This is
another example of the "TV test pattern" phenomenon, but in this case
two distinct levels of higher signal, running orthogonal to the read-out
channels are seen in each array. Furthermore, the W2 image shows
another elevated but wedge-shaped region in the bottom third of the
array. |
 |
| Figure 6f - Single-exposure frameset
15260r123. In this case, areas of the array show very high and
saturated backgrounds in the raw data, which were then converted to
NaN signal by the pipeline. The affected W1 and W2 areas, on the top and
left of the respective arrays, run orthogonal to the read-out
channels. The delimiter lines between the saturated (NaN) and normal
background regions of each array are very bright, and show the steep
transition of signal between these regions. |
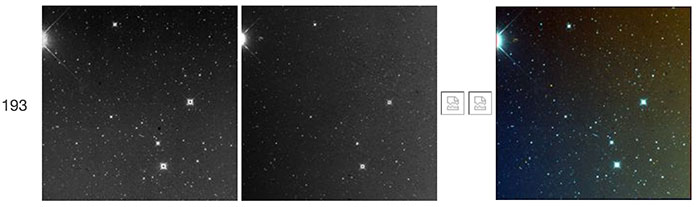 |
| Figure 6g - Single-exposure frameset
17108r193. This is another instance of areas of the array showing
higher backgrounds than surrounding regions. The affected W1 and W2
areas, on the bottom and right of the respective arrays, run
orthogonal to the read-out channels. Unlike typical instances of
this phenomenon, in which signal jumps in a sharp step, the signal
here changes gradually across the array, as can be seen in Figure 6h, below. |
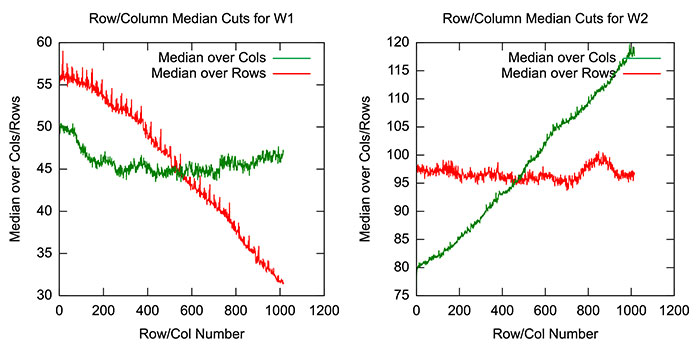 |
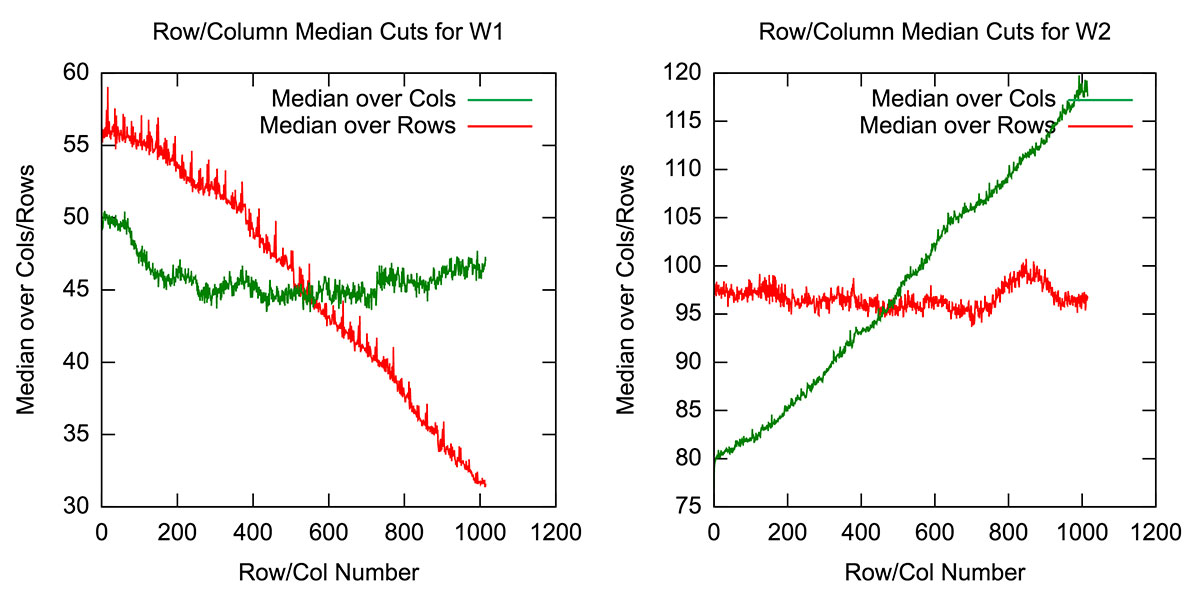
| Figure 6h - Single-exposure frameset 17108r193.
Signal medians over columns and over rows are shown for the W1 (left
panel) and W2 (right panel) arrays described in Figure 6g, above. The
left panel shows that the median row signal in W1 (red line) drops
gradually from the bottom of the array to the top, and that it exhibits
banding or rippling. The right panel shows that the median column signal
in W2 (green line) rises gradually towards the right side of the array. |
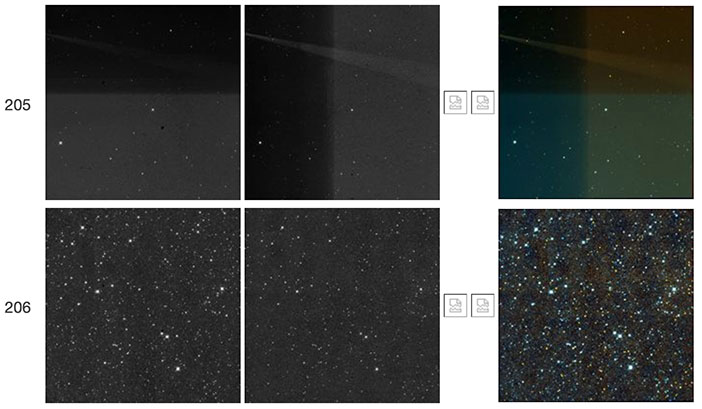 |
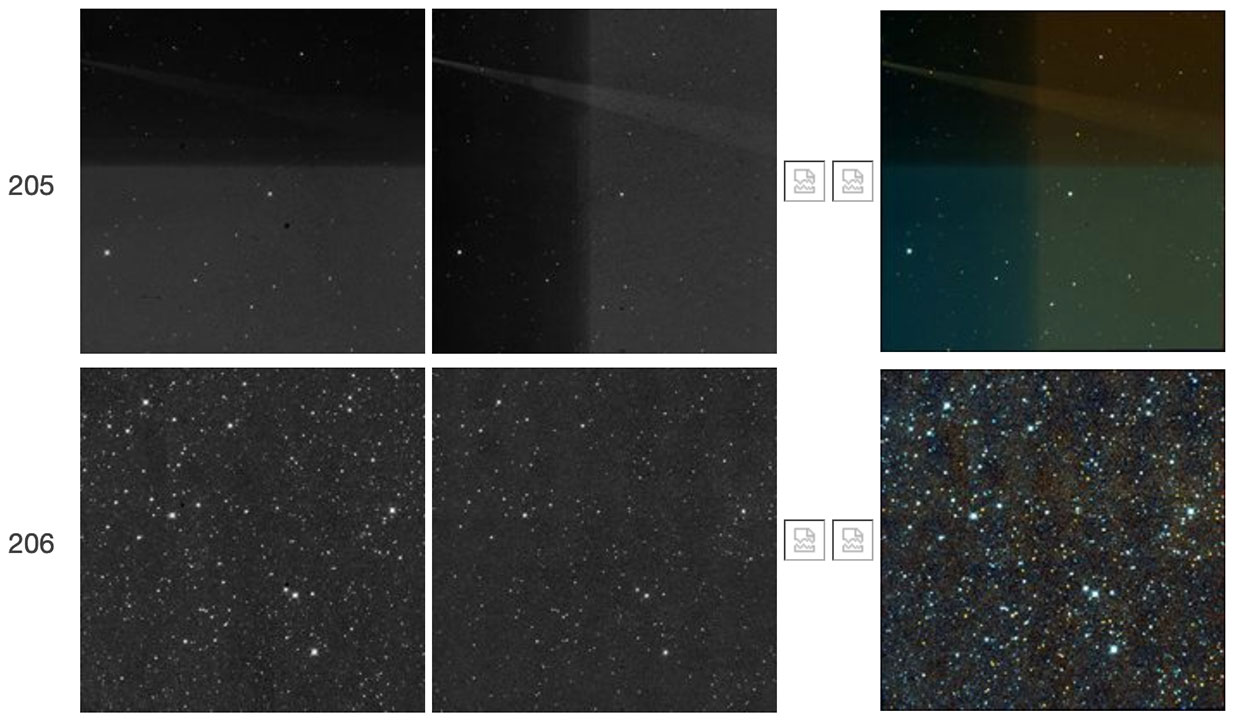
| Figure 6i - Single-exposure framesets 52876r205-206.
The "TV test pattern" in frameset 205 shows a narrow wedge-shaped region of elevated counts in W2
in addition to the usual rectangular region of elevated counts.
|
Electronic effects: Unusual cosmic ray effects
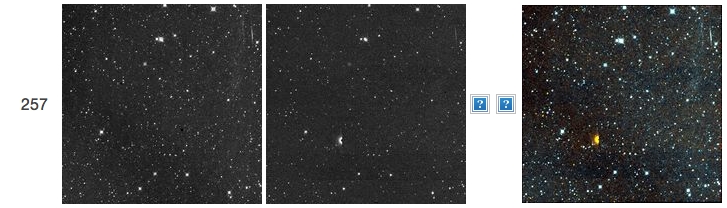 |
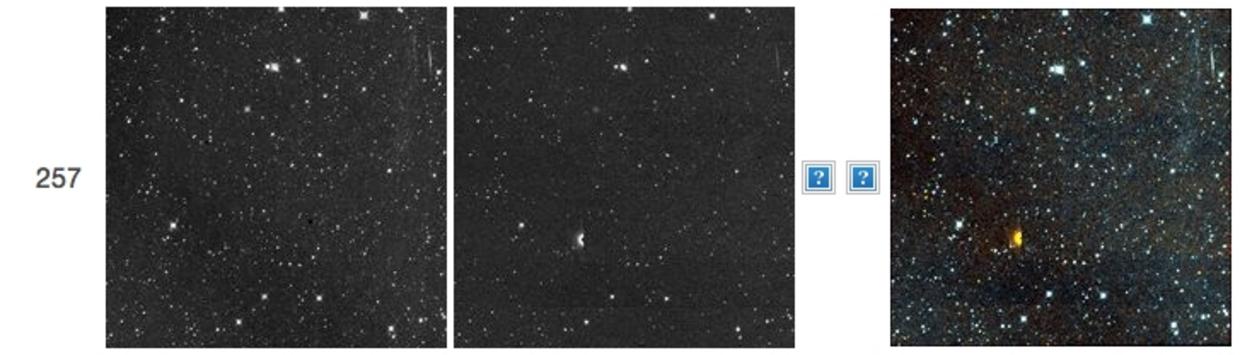
| Figure 7 - Single-exposure frameset 70118a257.
A cosmic ray in W2 exhibits
a semi-circular shape. The bisection is likely
due to the cosmic ray having struck partway through the read-out. |
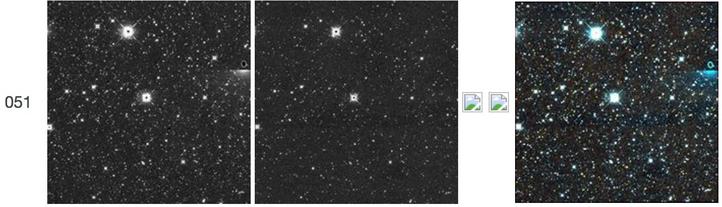 |
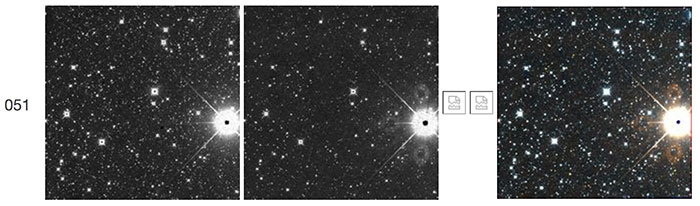
| Figure 8 - Single-exposure frameset 75065a051. A
cosmic ray in W1 exhibits a semi-circular shape. The truncation is
likely due to the cosmic ray having struck partway through the read-out.
|
 |
| Figure 9 - Single-exposure frameset 63814a078. A
radiation hit in W1 produces a small, point-like but saturated detection
(pure blue) toward the center of the frame. |
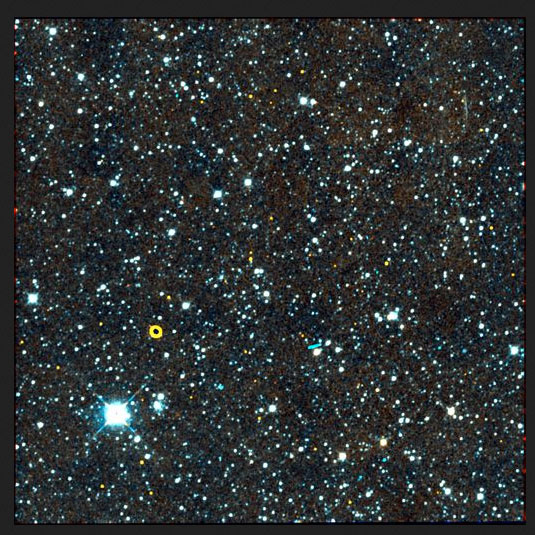 |
| Figure 10 - Single-exposure frameset 86204a253. A
radiation hit in W2 produces a somewhat larger, point-like but saturated
detection (yellow) in the lower left quadrant of the frame. |
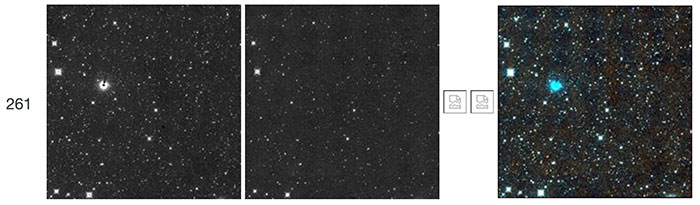 |
| Figure 10a - Single-exposure frameset 92331a261. A
radiation hit in W1 exhibits a "shadow" effect at the top of the
feature. This effect is likely from a bad pixel that blocks some of the
radiation from the cosmic ray. |
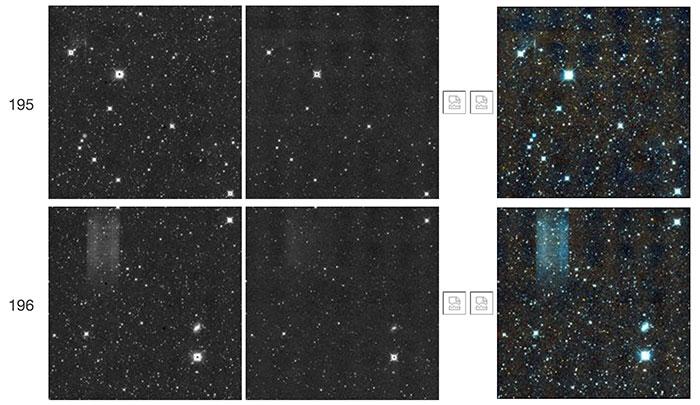
Electronic effects: Latents from unusual sources
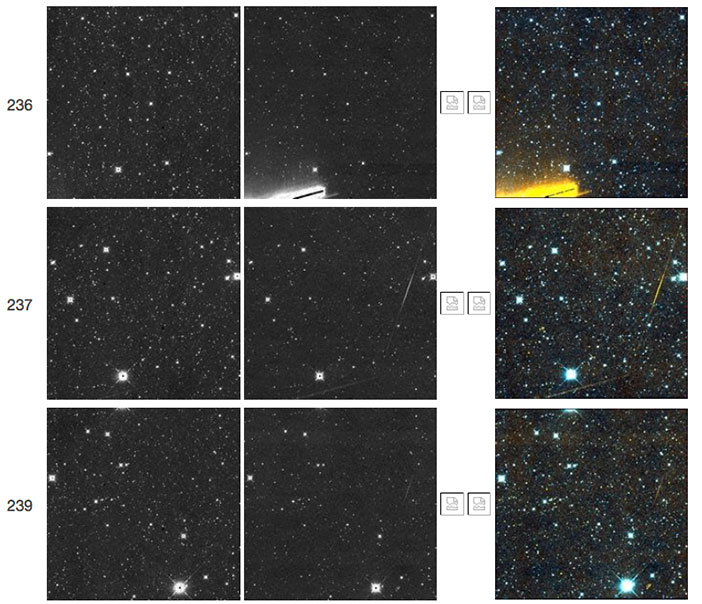 |
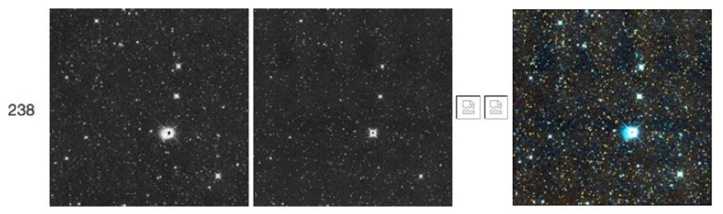
| Figure 11 - Single-exposure frameset 80973a236-239.
A latent is seen in W2 frames 237 and 239 despite the fact that there
is no obvious parent object at the same array position in frame 236. The
bright source producing this latent likely appeared in the field of
view just after that portion of W2 frame 236 was read out. |
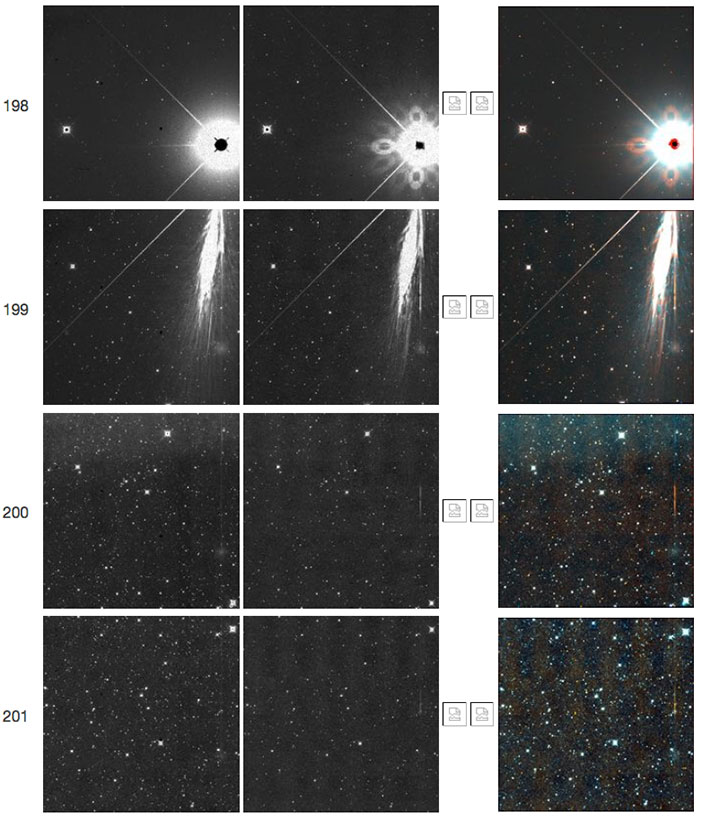 |
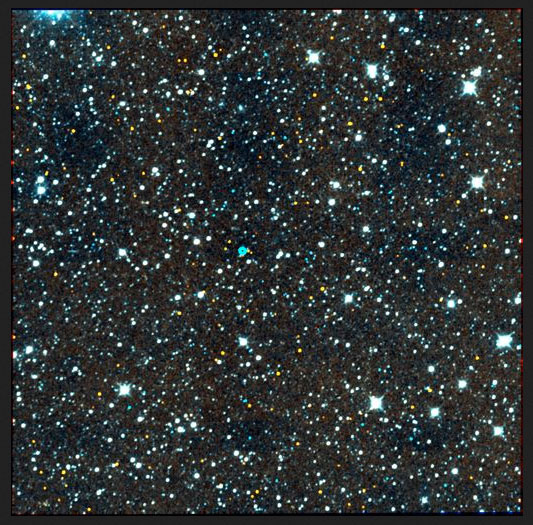
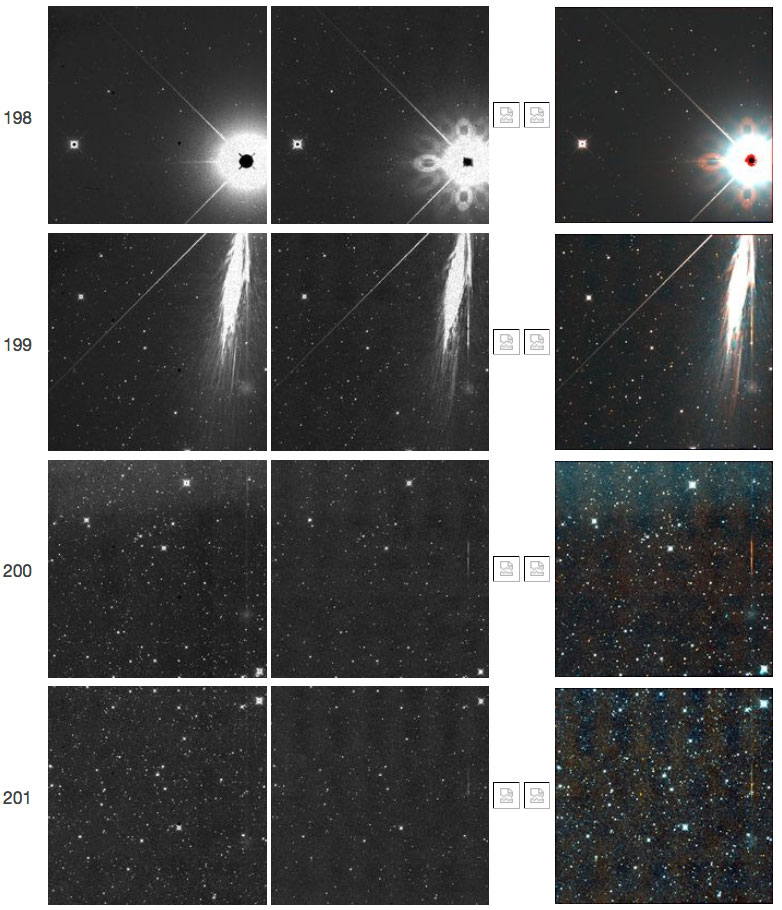
| Figure 12 - Single-exposure frameset 82165b198-201.
A latent is seen in W2 frames 199, 200, and 201. The source of this
latent is the smeared image of the bright star R Doradus, when the scan
mirror was flipped to take frameset 199. The bright part of the latent
falls in the long-decay, short-term latent area discussed in section III.2.c.ii.3. |
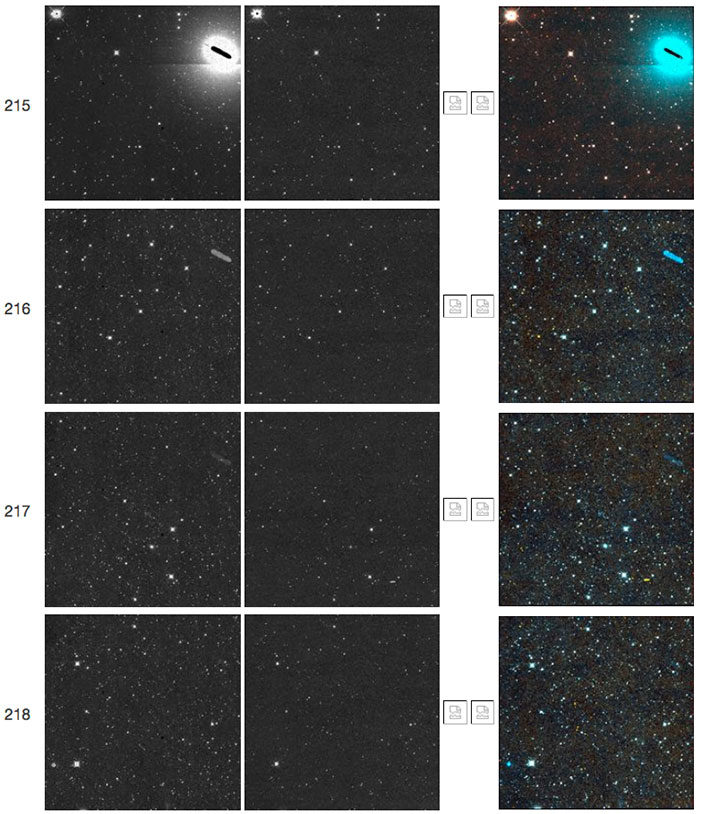 |
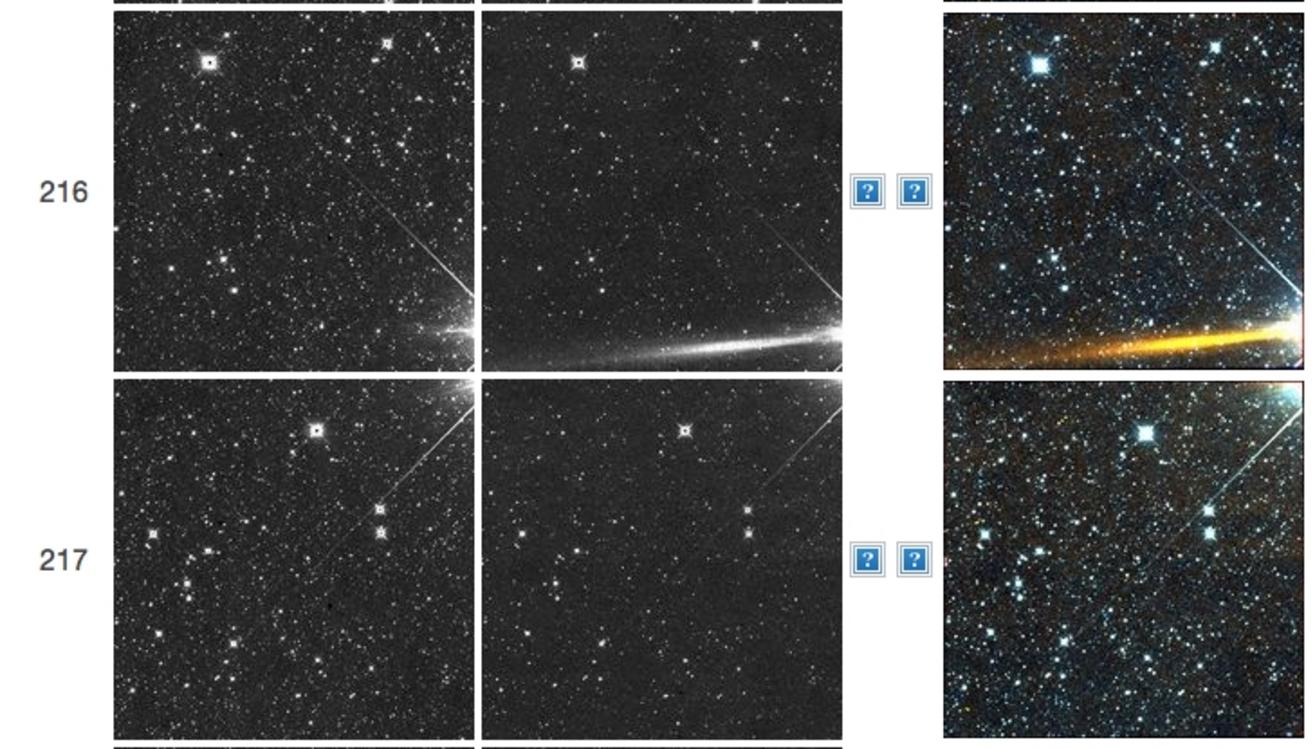
| Figure 13 - Single-exposure frameset 83161b215-128.
A latent is seen in W1 frames 216 and 217. The source of this latent is
a powerful radiation hit in frame 215. |
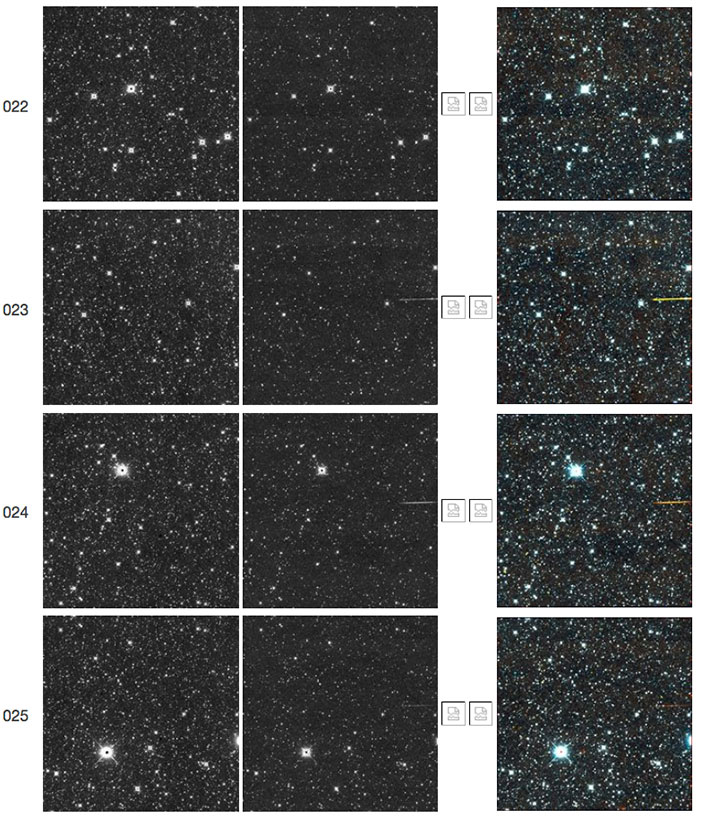 |
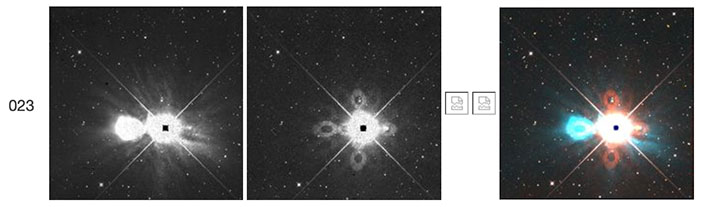
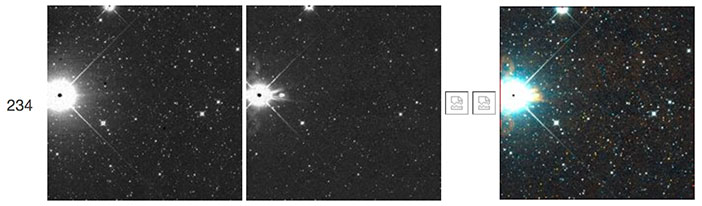
| Figure 14 - Single-exposure frameset 83354a022-025.
A latent is seen in W2 frames 023-025. The source of this latent was
not captured in the earlier images, presumably because it moved through
the field after that part of the array was read out for frame 022. |
 |
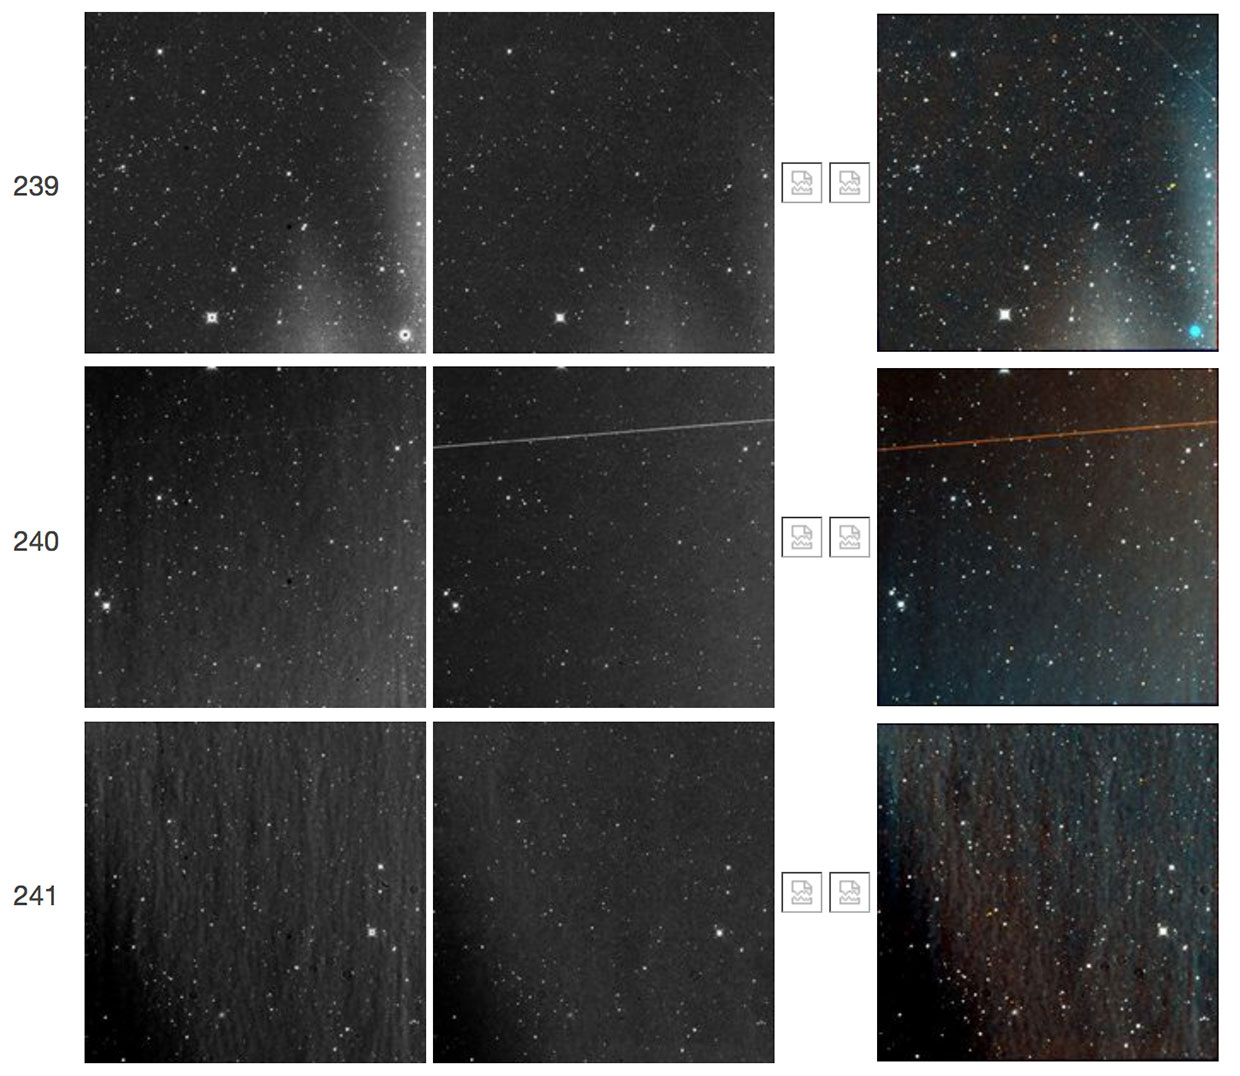
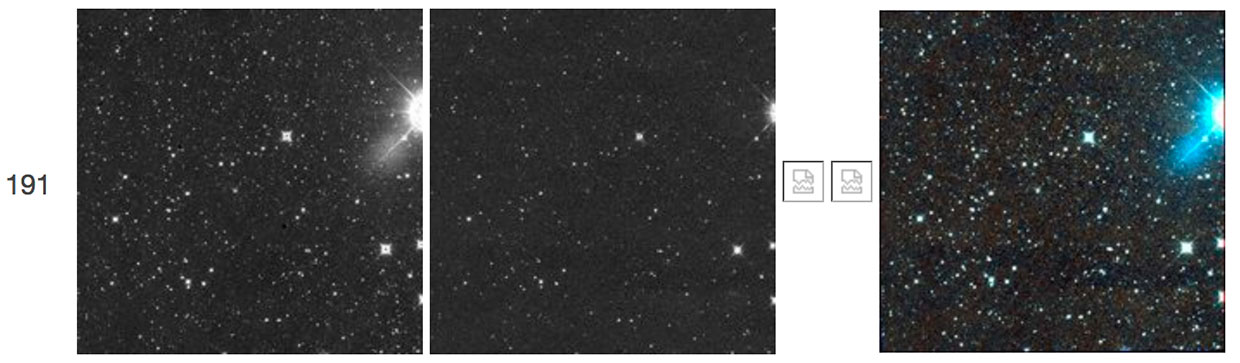
| Figure 14a - Single-exposure framesets
30092r239-241. This example shows glow from an object off the bottom
edge of frameset 239 and a latent of a satellite trail in frameset 240.
The cause of the glow and latent is not known, but a possible
explanation is that a satellite trail was not captured because it moved
through the field in between these two framesets. Moon glow is also
present. |
Effects from Bright Objects:
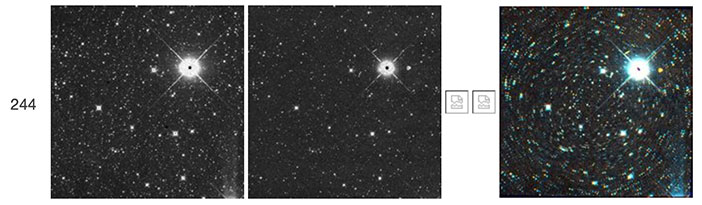
The character of bright object artifacts in the NEOWISE Reactivation
data is similar to that seen in the Post-Cryo data. Details on these
artifacts can be seen in section VIII.2.b.i in the All-Sky Explanatory Supplement. The particular effects discussed here are not mentioned in the Post-Cryo documentation.
Effects from Bright Objects: pixel shadow
 |
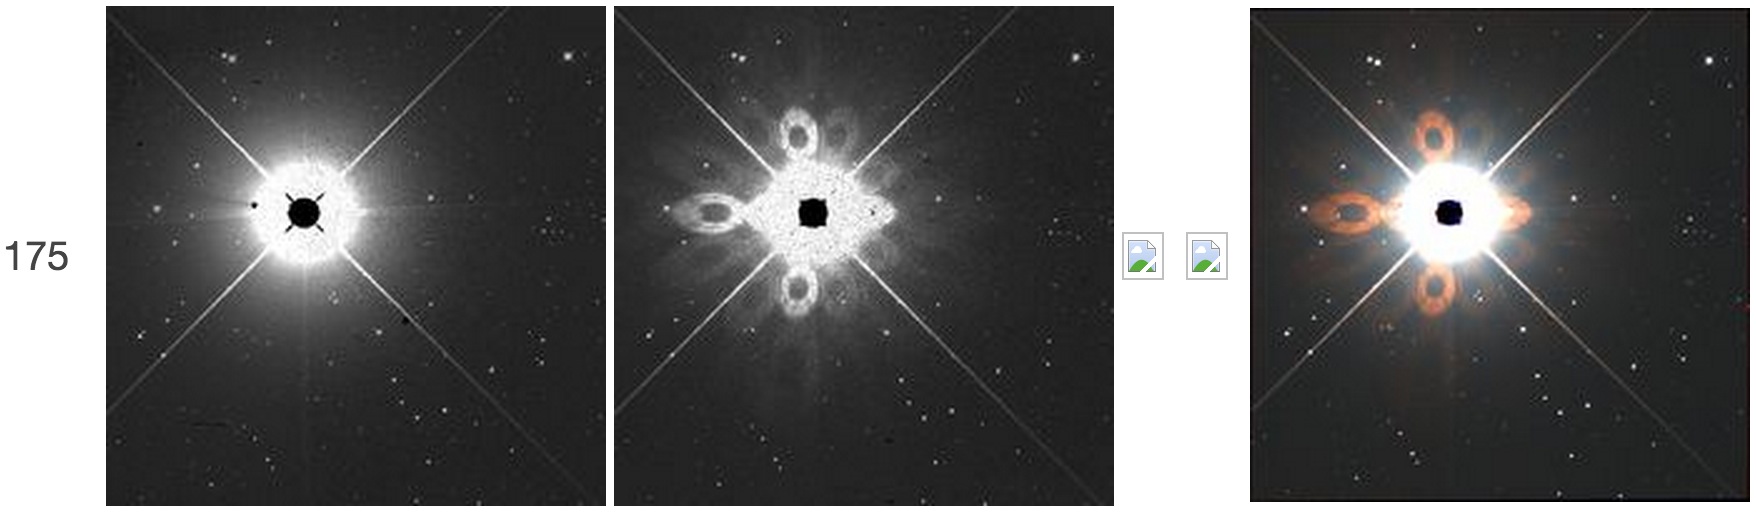
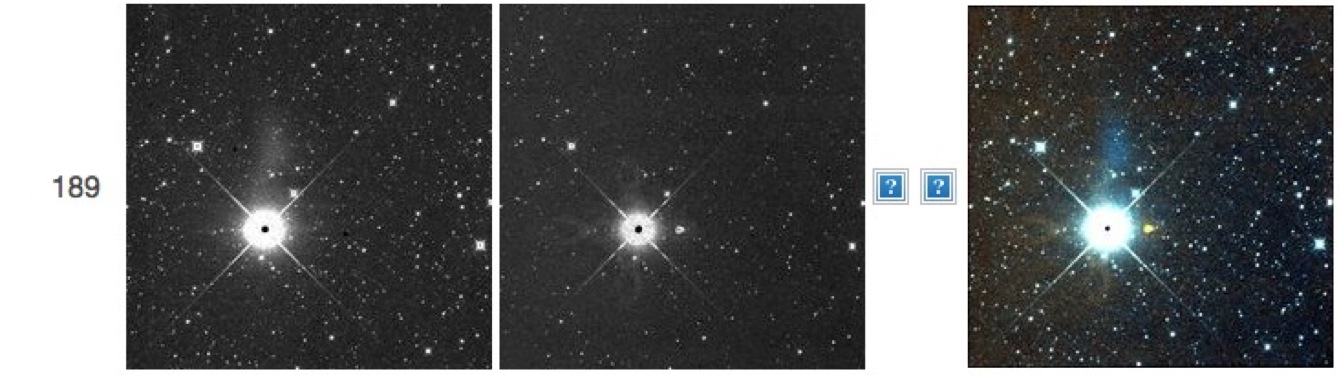
| Figure 15 - Single-exposure frameset 45613b175.
Clumps of pixels in W1 can appear to block light from bright stars,
causing a shadow effect in the halo of the PSF. These pixel groups get
masked as bad pixels (NaNs) during processing because of their abnormal
sensitivities. It is likely that there is a surface deposit that is
affecting the sensitivity and blocking the light from bright stars. In
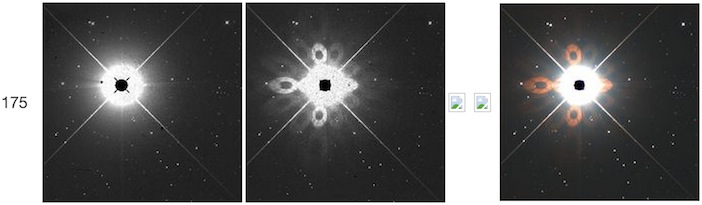
this example, a group of masked pixels (black in the JPEG) is seen on
the left edge of the bright star W Hya. |
 |
| Figure 15a - Single-exposure frameset 97056a051.
Clumps of pixels in W2 can also appear to block light from bright stars,
causing a shadow effect in the halo of the PSF. These pixel groups
also get masked as bad pixels (NaNs) during processing. This phenomenon
is more commonly seen in W1, so this instance in W2 is rare. In this
example, a group of masked pixels (black in the JPEG) is seen at the top
of the bright carbon star GY Camelopardalis. A detailed image is shown
below. |
 |
| Figure 15b - Single-exposure frameset 97056a051. This is a zoomed-in version of the W2 image shown in Figure 15a. |
Effects from Bright Objects: Extended ghosting
The following instances have been seen in W1.
 |
| Figure 16 - Single-exposure frameset 52900a184. The
ghost light to the left of the bright star in the W1 image occurs when a
star with a saturated core lands directly on top of a clump of pixels
near the X,Y position 610,377. A possibly related instance was noted in
previous WISE data releases; see Figure 55, second panel
of section VIII.2.b.i of the Post-Cryo documentation. It is likely the
ghosting is caused by a surface deposit on the array that is reflecting
light from the bright star. Currently there are nine such suspected
clusters of pixels or surface deposits in the W1 array, illustrated in
this and Figures 17-24c, and in Figure26b of section II.4.b.ii of the AllSky documentation. |
 |
| Figure 16a - Single-exposure frameset 44642r023.
Another instance of the ghost light illustrated in Figure 16, but much
more dramatic. The star lands very close to the X,Y position 610,377. |
 |
| Figure 17 - Single-exposure frameset 62509b238. Another
instance of the ghost light illustrated in Figure 16, but of reduced intensity,
and occurring very close to the saturated star. The star lands very close to
the X,Y position 610,377. |
 |
| Figure 18 - Single-exposure frameset 72718a083.
Another instance of the ghost light illustrated in Figures 16 and 17,
but occurring to the right of the star. |
 |
| Figure 19 - Single-exposure frameset 73017a224.
Another instance of the ghost light illustrated in Figures 16 through
18, but occurring in multiple directions from the star. |
 |
| Figure 19b - Single-exposure frameset 92925a129.
Another instance of the ghost light illustrated in Figures 16 through
19, but occurring in multiple directions from the star and more
dramatically. |
 |
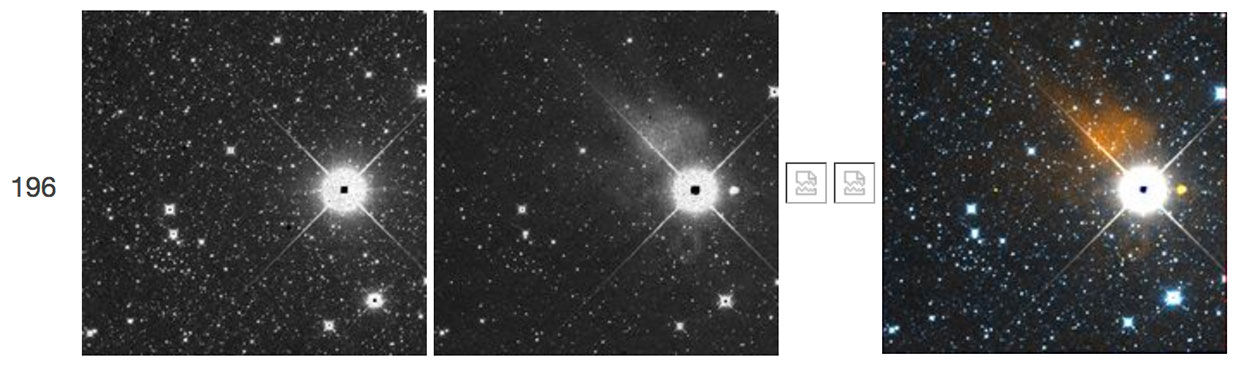
| Figure 20 - Single-exposure frameset 55846a189. The
ghost light above the bright star in the W1 image occurs when a star
with a saturated core lands directly on top of a clump of pixels near
the X,Y position 387,389. It is likely the ghosting is caused by a
surface deposit on the array that is reflecting light from the bright
star. |
 |
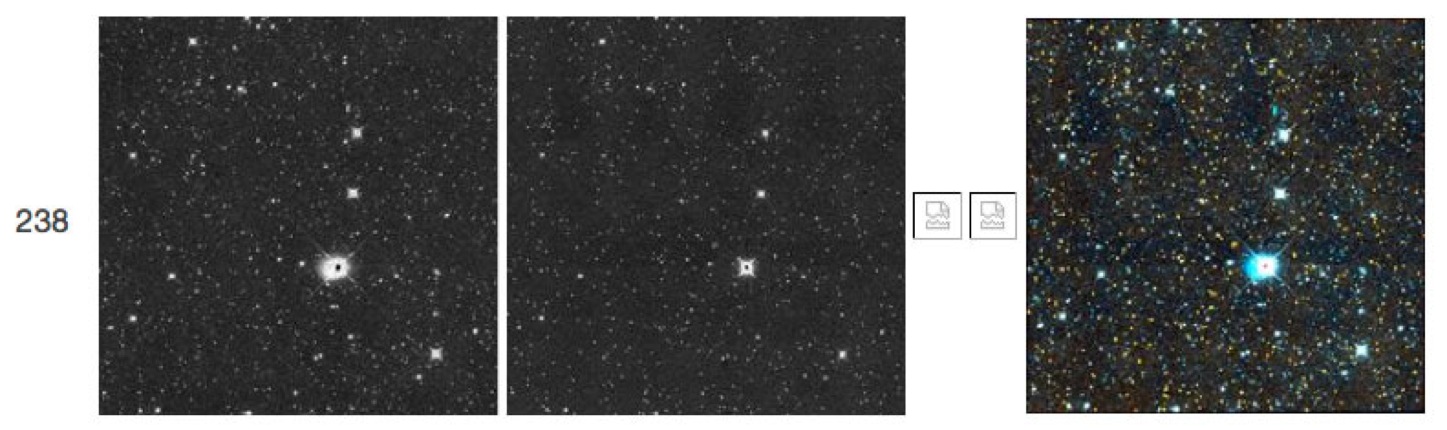
| Figure 21 - Single-exposure frameset 65032a021. The
ghost light towards the upper-left corner, from the neighboring bright
star in the W1 image, occurs when a star with a saturated core lands
directly on top of a clump of pixels near the X,Y position 117,947. It
is likely that the ghosting is caused by a surface deposit on the array
that is reflecting light from the bright star. |
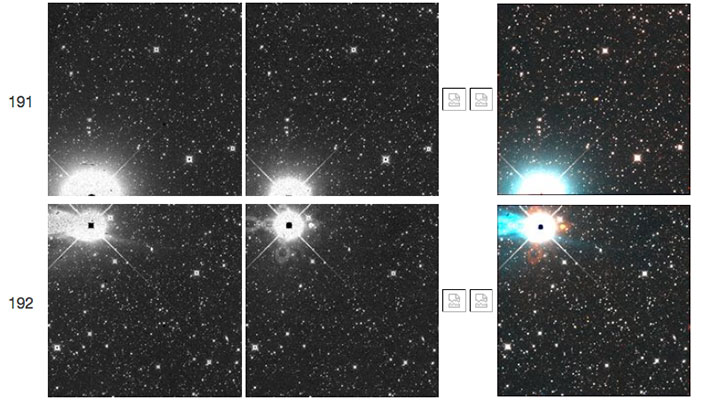 |
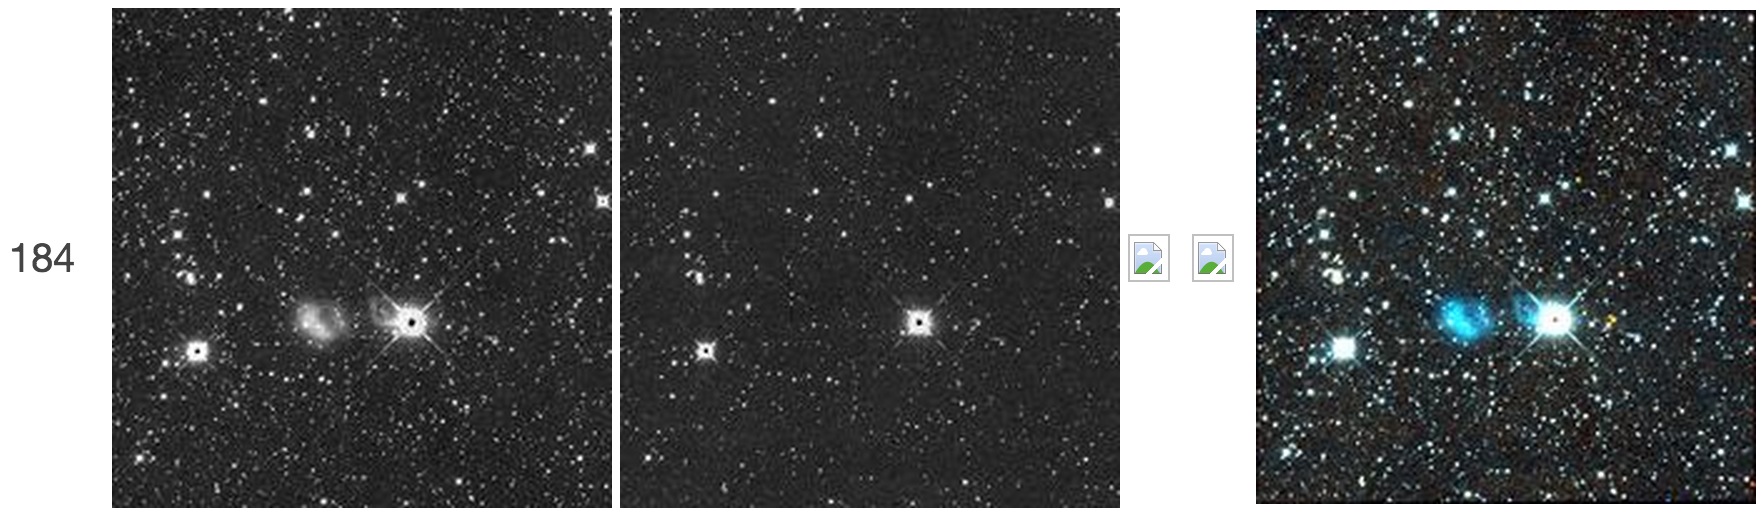
| Figure 22 - Single-exposure frameset 80264a191-192.
At upper left, a broad ghost is seen in W1 from the bright star located
near X,Y position 226,901. This pixel position is considerably
different from the bright star position shown in Figure 21, leading us
to believe this is caused by a different surface deposit on the array. |
 |
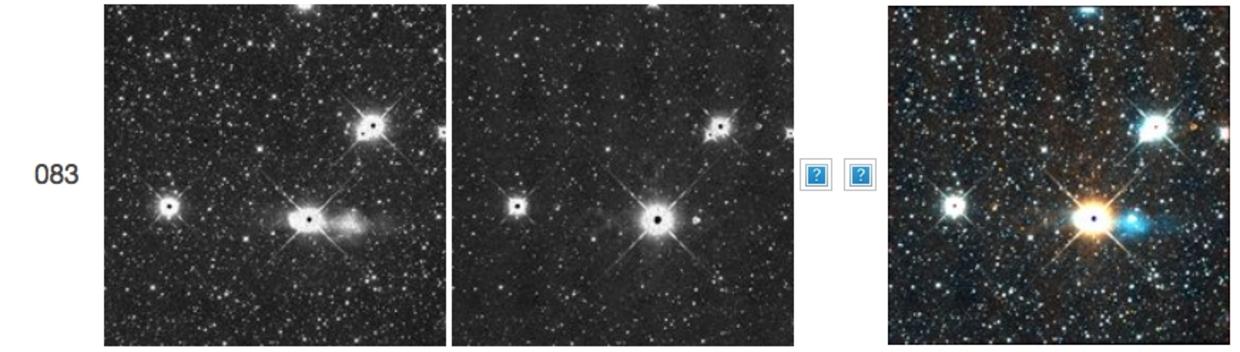
| Figure 23 - Single-exposure frameset 81405a197.
Although odd ghosting has been seen in this part of the array ever since
the 4-band cryo mission, this is one of the brightest stars (at X,Y =
899,522) ever noted as having caused the characteristic upper and lower
ghosting here. |
 |
| Figure 24 - Single-exposure frameset 86284a001. The W1 ghosting in this image is caused by a bright star at X,Y = 963,603. |
 |
| Figure 24a - Single-exposure frameset 12081r055.
The W1 ghosting in this image is caused by a bright star at X,Y =
302,614. The cluster of bad pixels causing this ghosting is the same
cluster causing the pixel shadow in Figure 15. |
 |
| Figure 24b - Single-exposure frameset 18979r039. The W1 ghosting in this image is caused by a bright star at X,Y = 588,798. |
 |
| Figure 24c - Single-exposure frameset 21725r042.
The W1 ghosting in this image is most likely caused by the core of a
bright star falling on a clump of pixels near X,Y = 790,601. However, an
alternative explanation is that the ghosting consists of an unusual
glint due to a bright source off the array. |
 |
| Figure 24c2 - Single-exposure frameset 47316r081.
The W1 ghosting in this image is most likely caused by the
bright star falling on the righthand side of the array, near X,Y = 1016,709. |
The following instances have been seen in W2.
 |
| Figure 24d - Single-exposure frameset 02222r196. The W2 ghosting in this image is caused by a bright star at X,Y = 773,489. |
 |
| Figure 24e - Single-exposure frameset 07653r234.
The W2 ghosting in this image, which is far more subtle than the example
above, is caused by a bright star at X,Y = 66,549. |
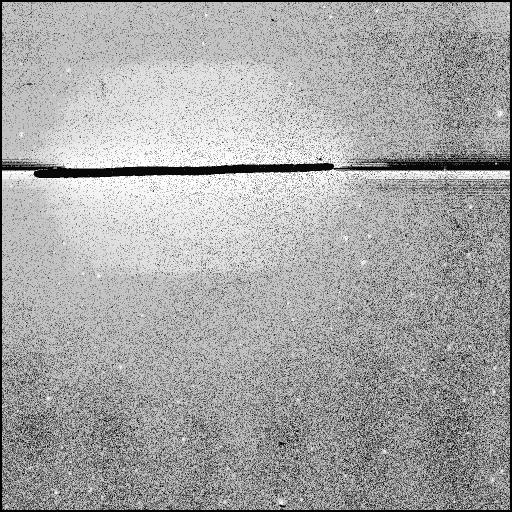
Effects from Bright Objects: Dark rectangular region in W1, in presence of off-array source
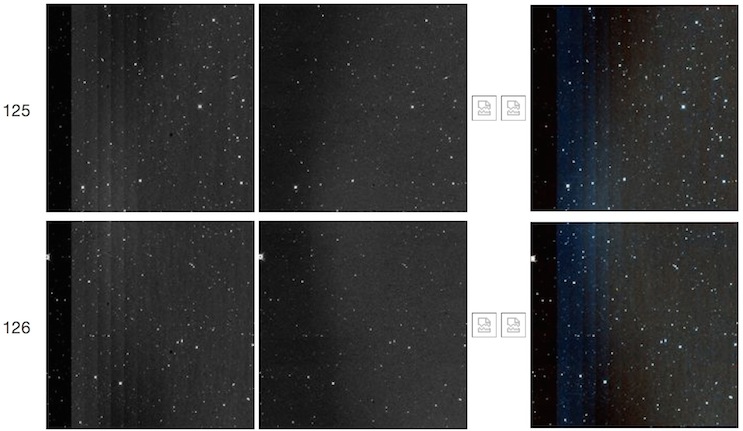 |
| Figure 25 - Single-exposure framesets
48781a125-126. A very bright source off the right-hand side of the field
of view causes a glow in the images. In some instances, frames exhibit a
dark rectangular region on the left side of the W1 array, away from
the source, with a sharp contrast relative to the glow pattern. The glow
itself has been seen in previous WISE data releases
(see Figure 15
of section VIII.2.b.i of the Post-Cryo documentation). The dark
rectangle in W1 is new in NEOWISE Reactivation images, and is seen only
in pipeline-processed data (it is not present in the raw data). It
occurs when there is a large background gradient perpendicular to the
detector read-out channels (aligned vertically in W1). The pipeline has
difficulty correcting for the channel-to-channel variations, resulting
in large residual backgrounds. Although pipeline modifications were made
to mitigate this effect, some instances (such as the one illustrated
here) still occur.
|
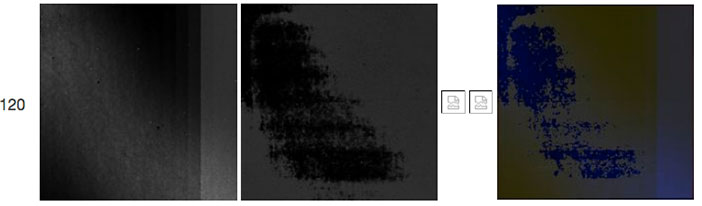 |
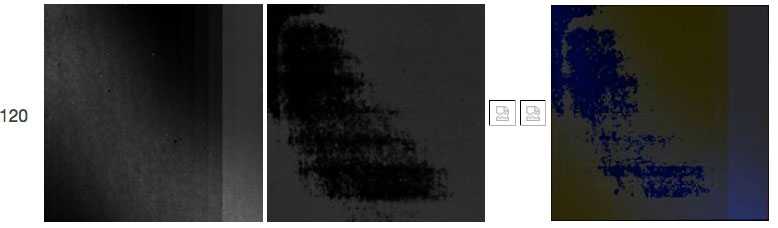
| Figure 26 - Single-exposure framesets 78349a120.
This is another instance of a rare pipeline-induced step in the W1
backgrounds, this time produced by extremely high count levels caused by
scattered moonglow.
|
 |
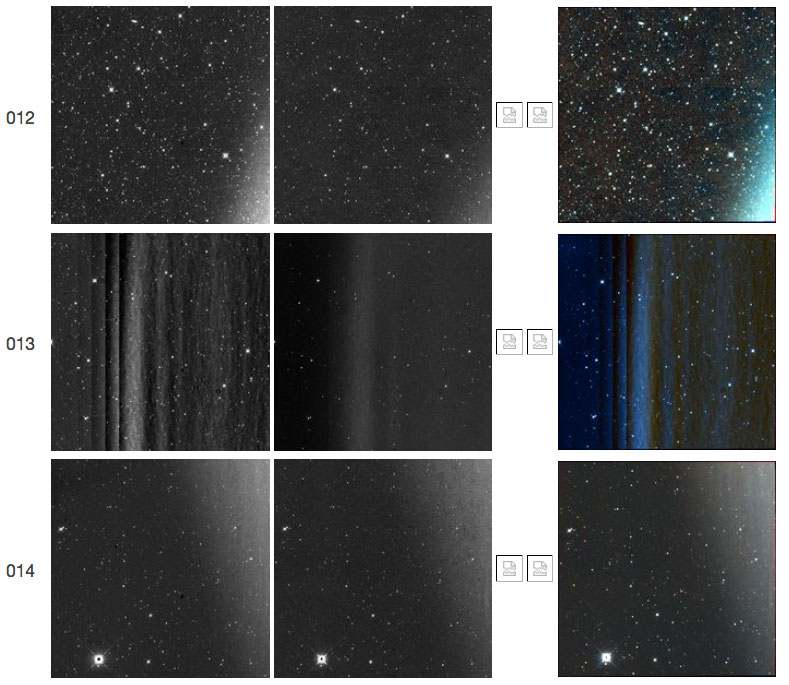
| Figure 27 - Single-exposure framesets
88659a012-014. This is another instance of rare pipeline-induced steps
in the W1 backgrounds, this time produced by scattered light from a very
bright star just off the right edge of the frameset.
|
Effects from Bright Objects: Glints from point sources
Although glints from bright point sources are seen during previous phases of the
mission (All-Sky,
3-band Cryo, and
Post-Cryo data releases), some manifestations have apparent
prominence in the NEOWISE Reactivation data.
A comparison and study of the temporal evolution of glints across the
All-Sky and NEOWISE 2016 Data Releases is in Section III.2.c.i.
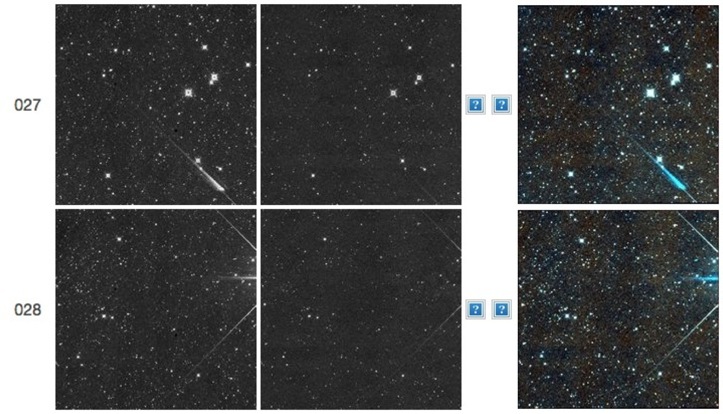 |
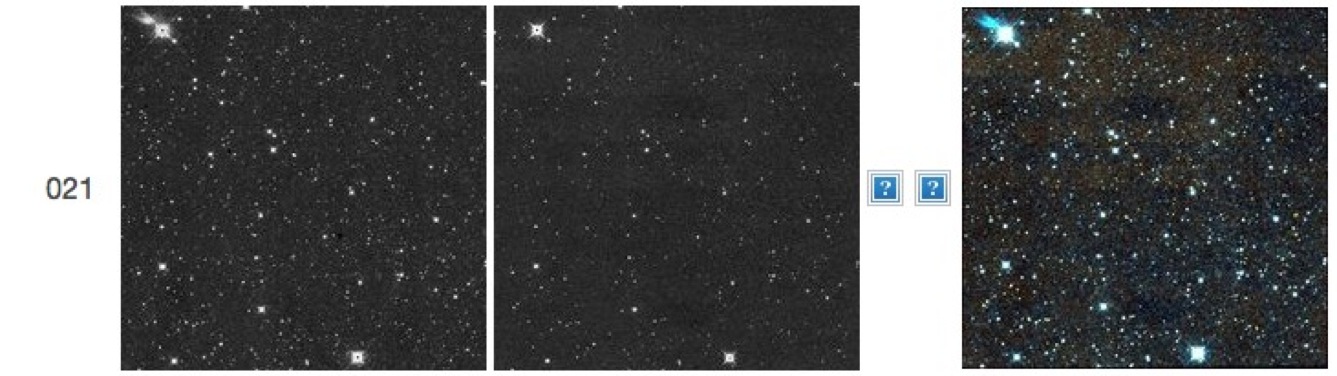
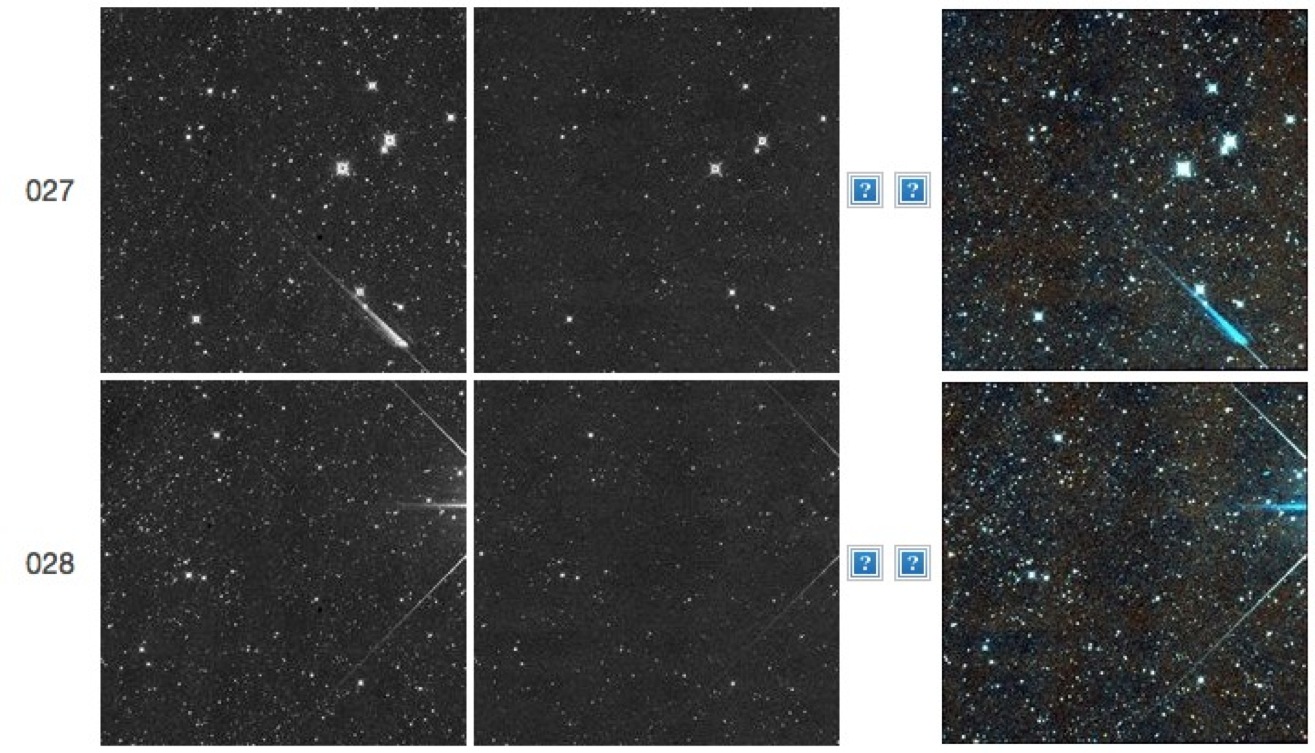
| Figure 28 - Single-exposure framesets 55538b027-028.
The glint running diagonally in the lower-right corner of frameset 027 is
unusual because it is laid out along a diffraction spike. The bright star
responsible for these features is just off the right-hand side edge of
framest 028. |
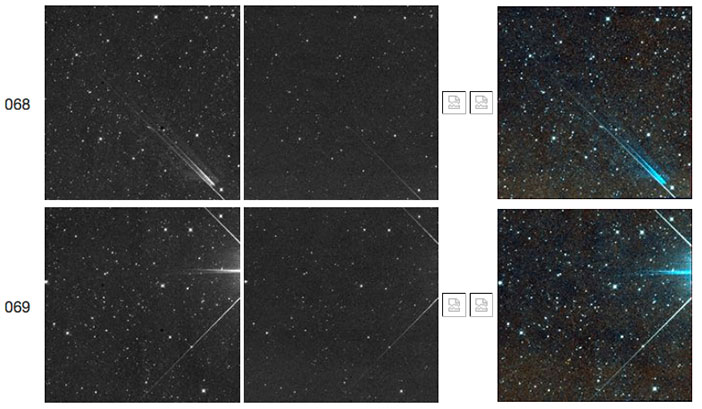 |
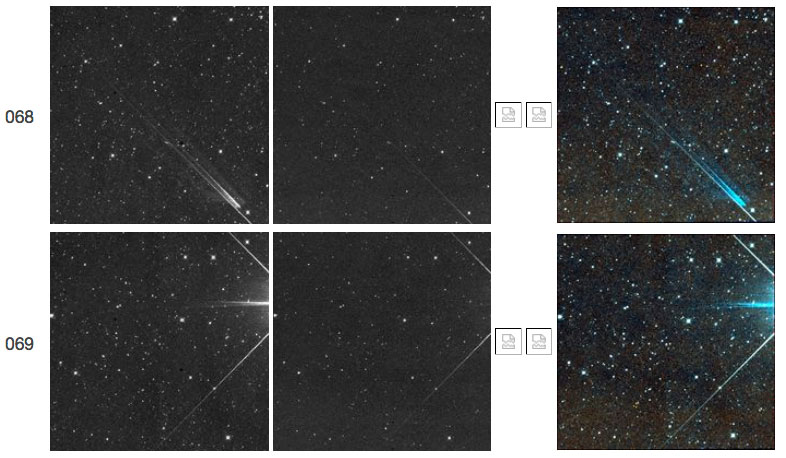
| Figure 29 - Single-exposure framesets
88670a068-069. In frameset 068 is another example of a glint running
parallel to a bright star diffraction spike. |
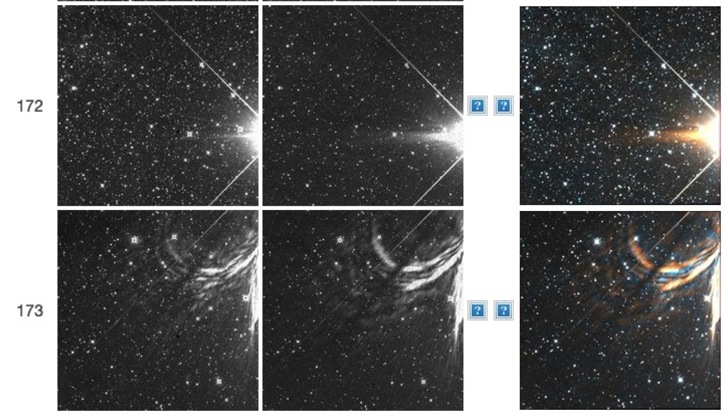 |
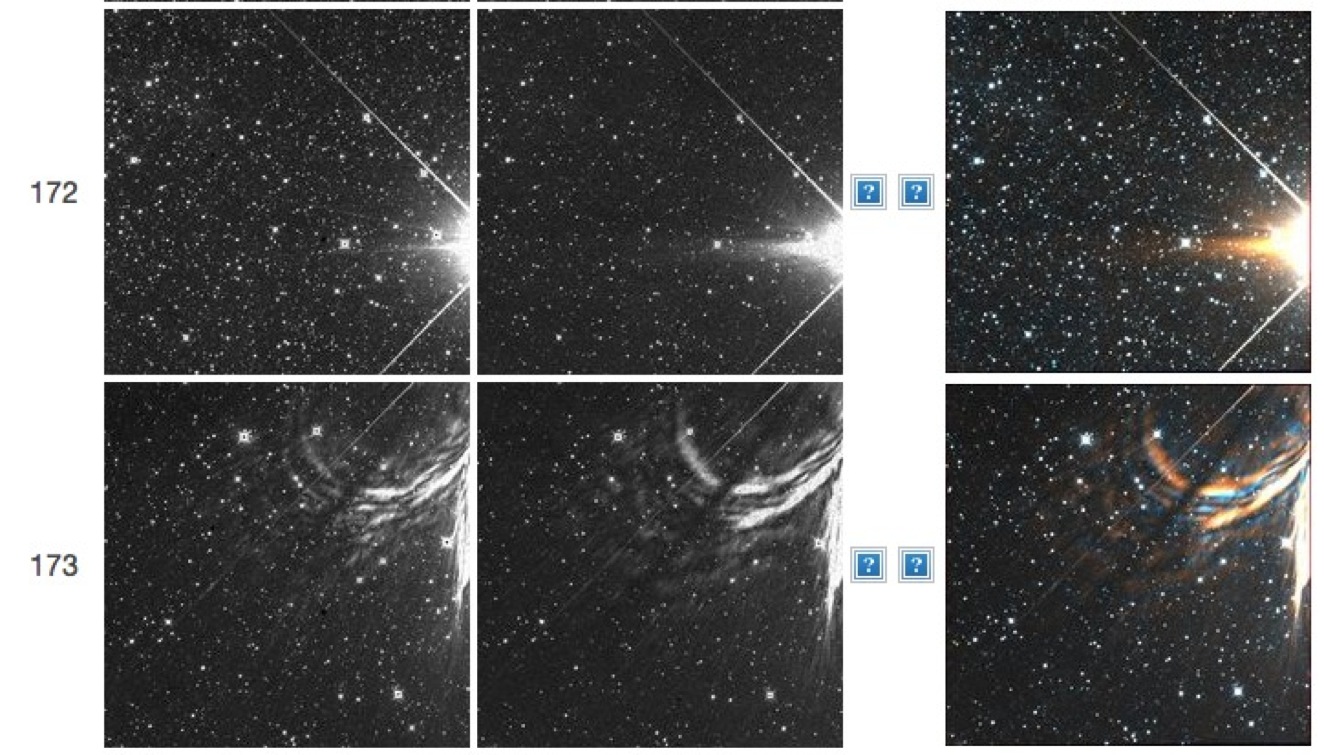
| Figure 30 - Single-exposure framesets 65198a172-173.
The "sickle-shaped" colorful glint in frameset 173 is produced by the bright
star just off the right-hand side edge of framest 172. The glint exhibits an
unusual "shadow" running diagonally across a significant portion of the W1 and
W2 arrays. The "shadow" is not exactly parallel to the diffraction spikes from the
star. |
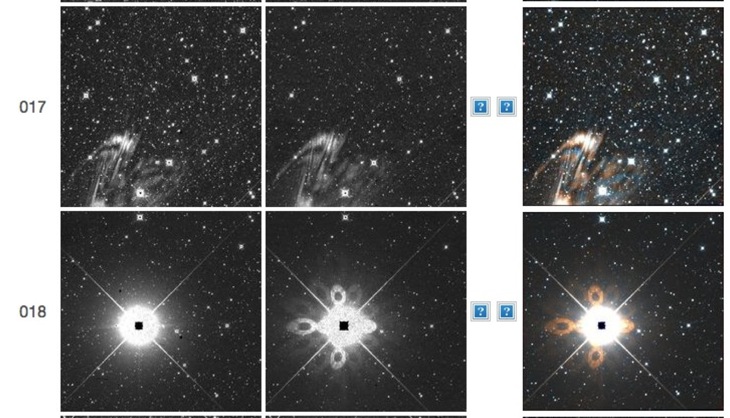 |
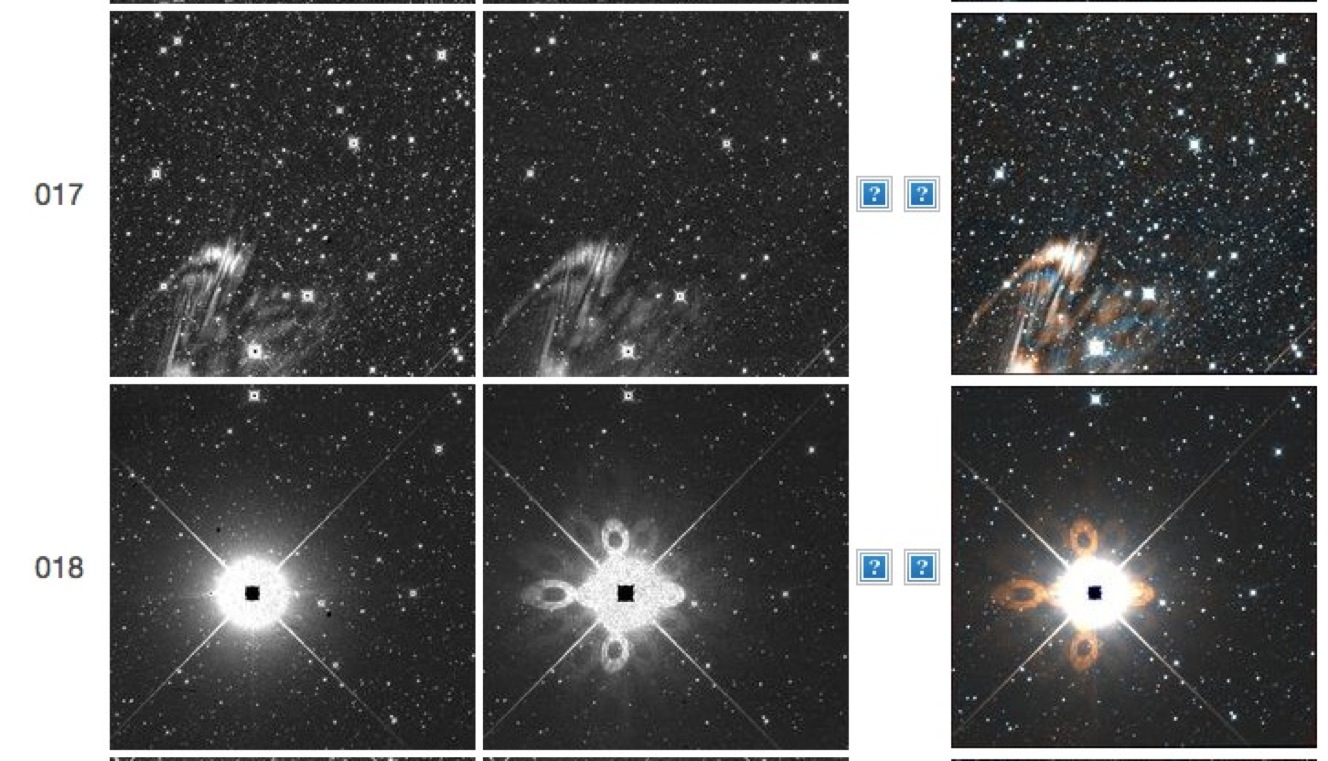
| Figure 31 - Single-exposure framesets 59049a017-018.
The curved, "fountain spray-shaped" glint in 017 is produced by the bright
star in 018. |
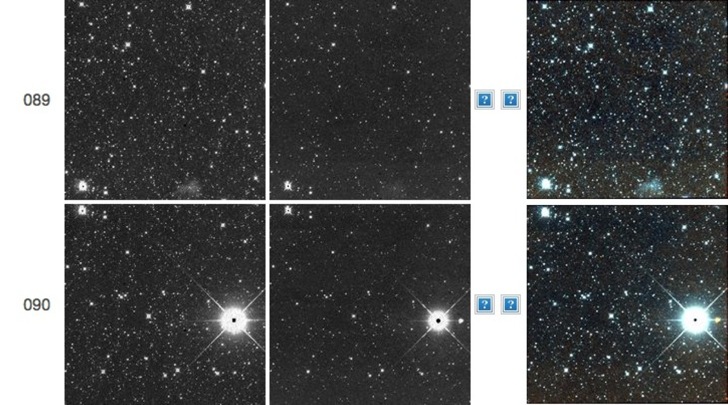 |
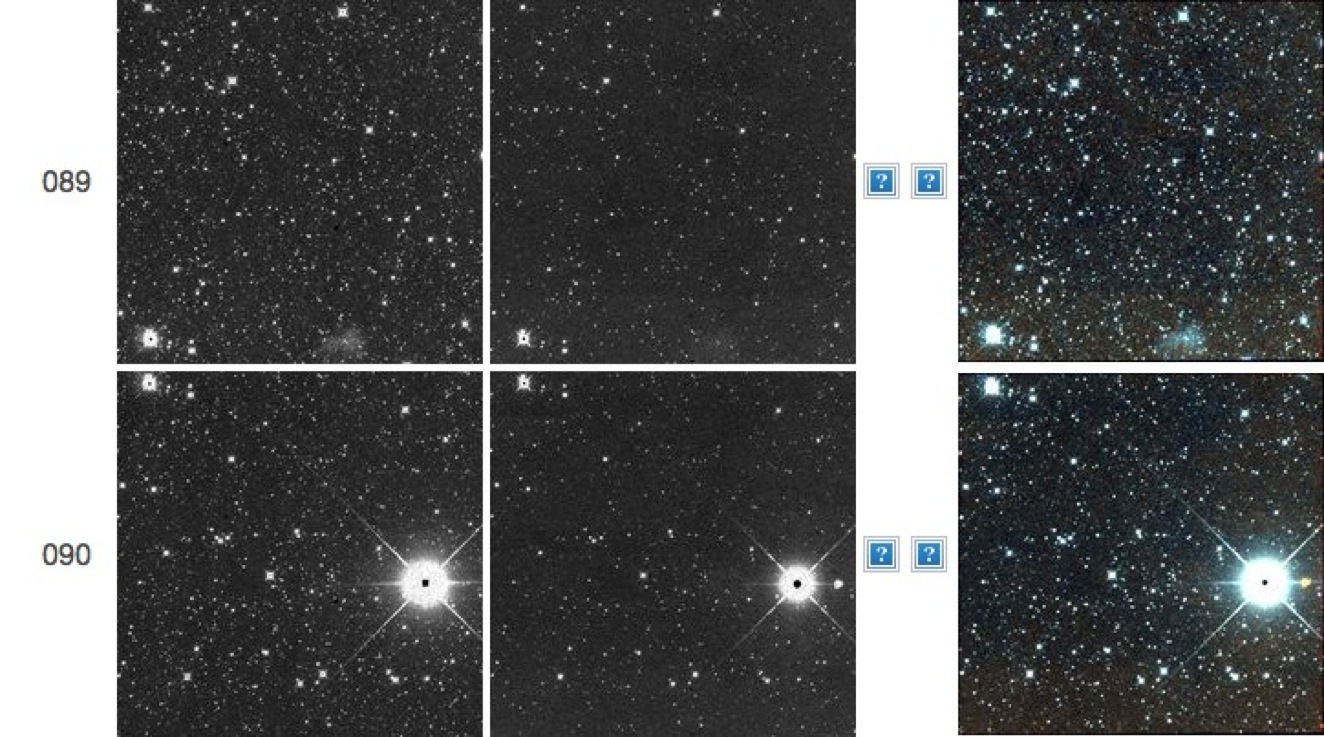
| Figure 32 - Single-exposure framesets 58041b089-090.
The tenuous blue glint in 089, resembling an "irregular galaxy," is produced
by the bright star in 090. |
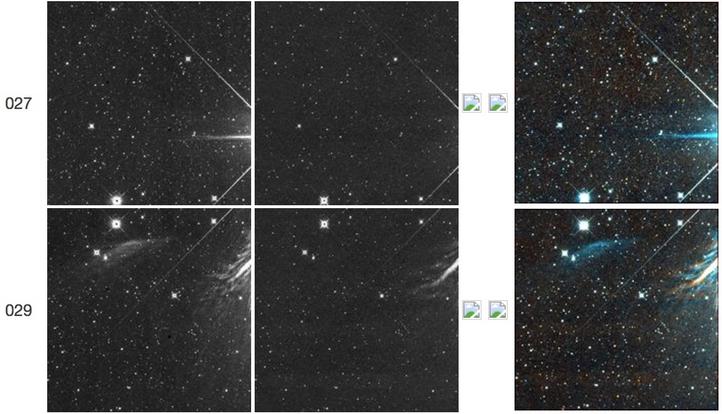 |
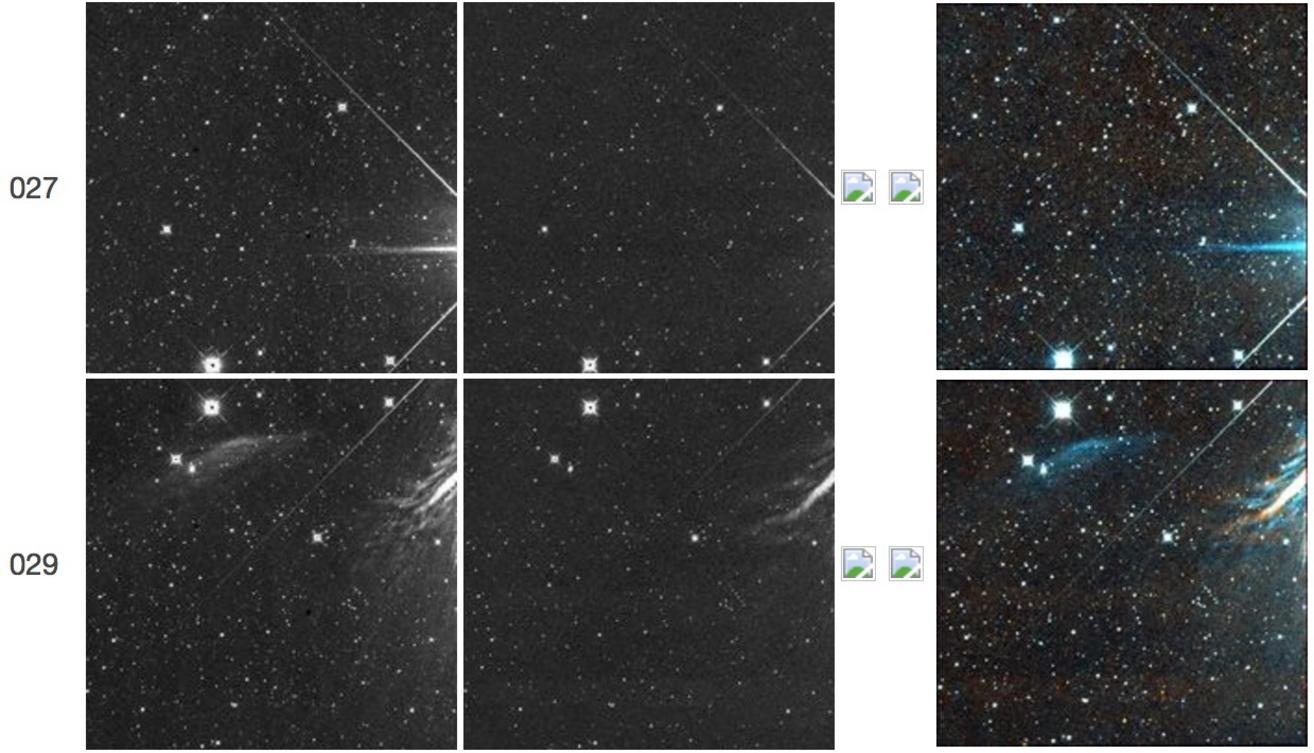
| Figure 33 - Single-exposure framesets
76477b027-029. The smeared blue (W1-only) feature in 029, towards the
top left of the array) is a "detached" glint from the bright source just
outside the field of view of 027. |
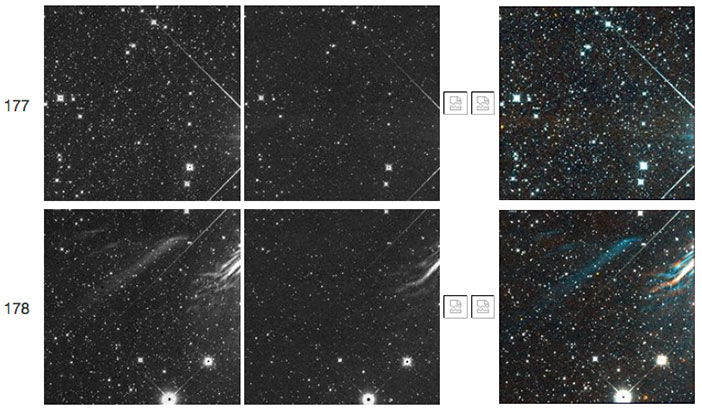 |
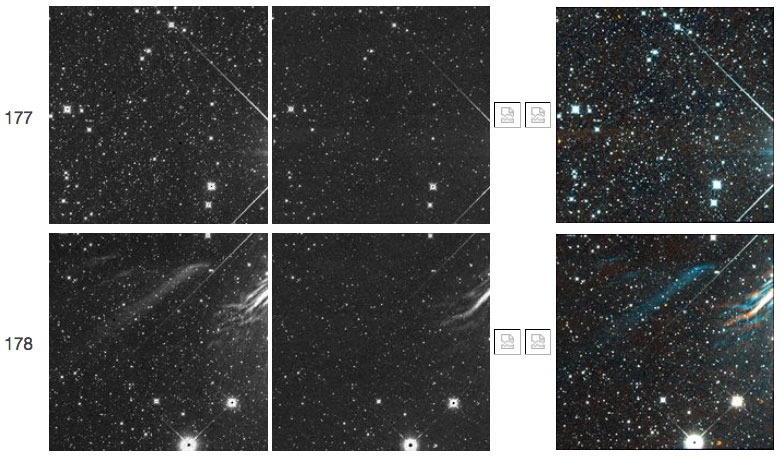
| Figure 34 - Single-exposure framesets
79009b177-178. Frameset 178 shows another example of a detached glint,
from a bright star just outside the field of view in frameset 177. |
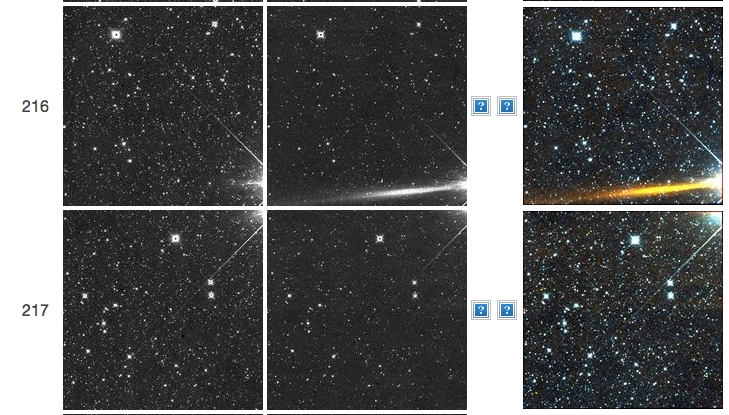 |
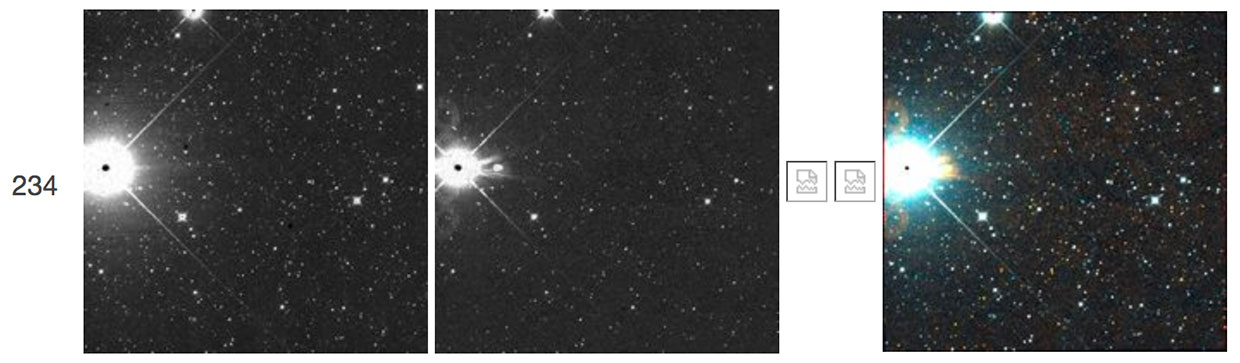
| Figure 35 - Single-exposure frameset 57729a216. A
glint from a bright source off the right-hand edge is very red, and has a
long, linear shape, inclined with respect to the horizontal direction. |
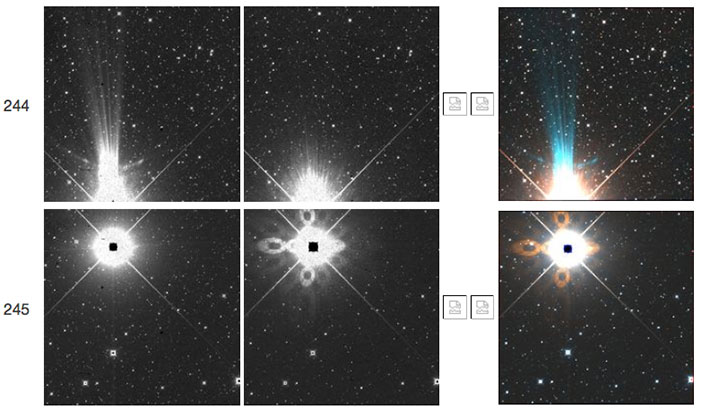 |
| Figure 36 - Single-exposure frameset 87274a244-245.
The bright star in frameset 245 creates a semi-circular W1 glint on
either side of the familiar spray-like W1 glint in frameset 245. |
 |
| Figure 36a - Single-exposure frameset 08161r191.
The bright star just off the edge of the frameset creates an additional
glow along its lower diffraction spike. |
Effects from Bright Objects: Severe Moon glow
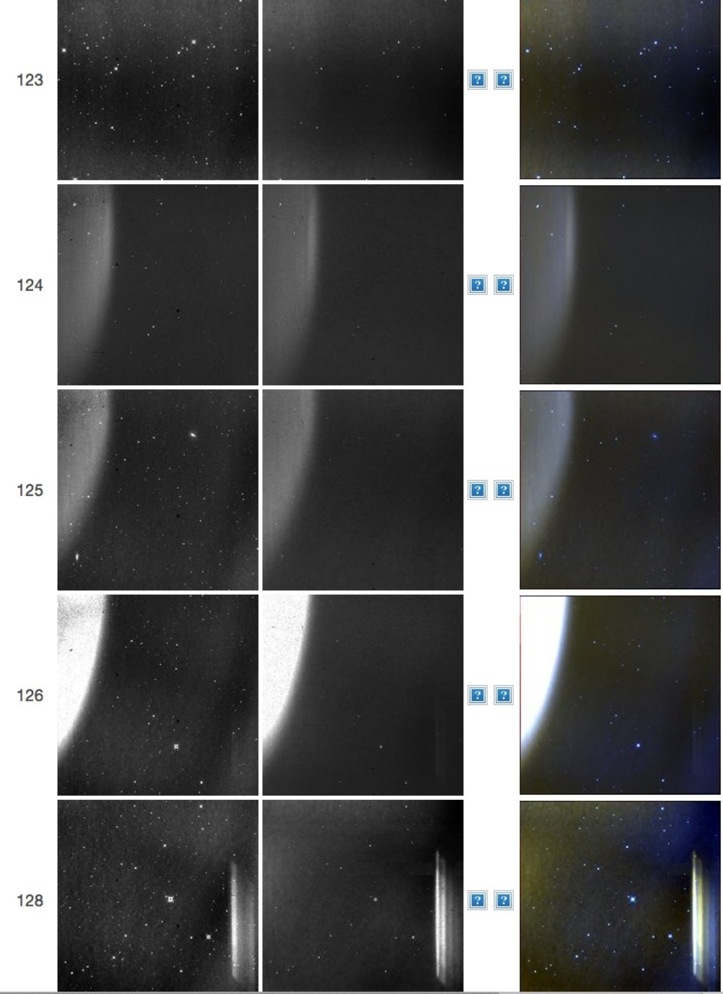 |
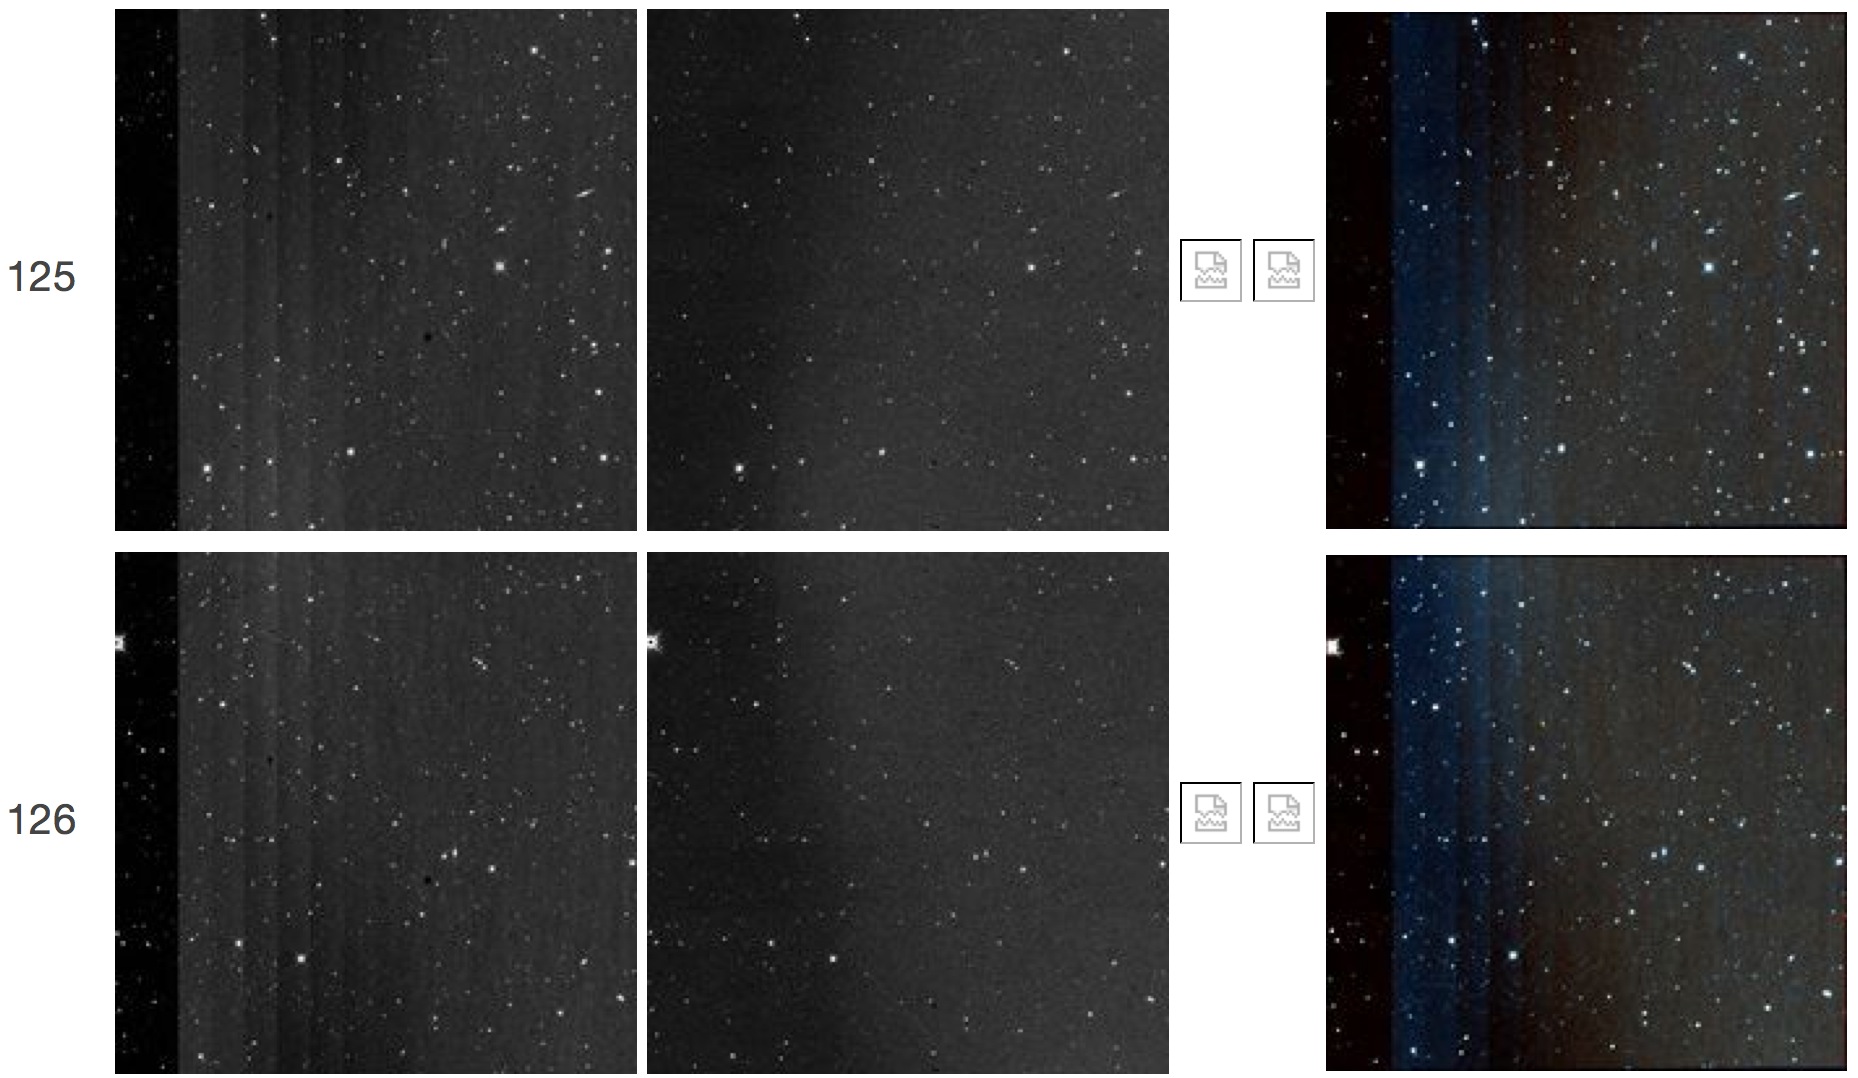
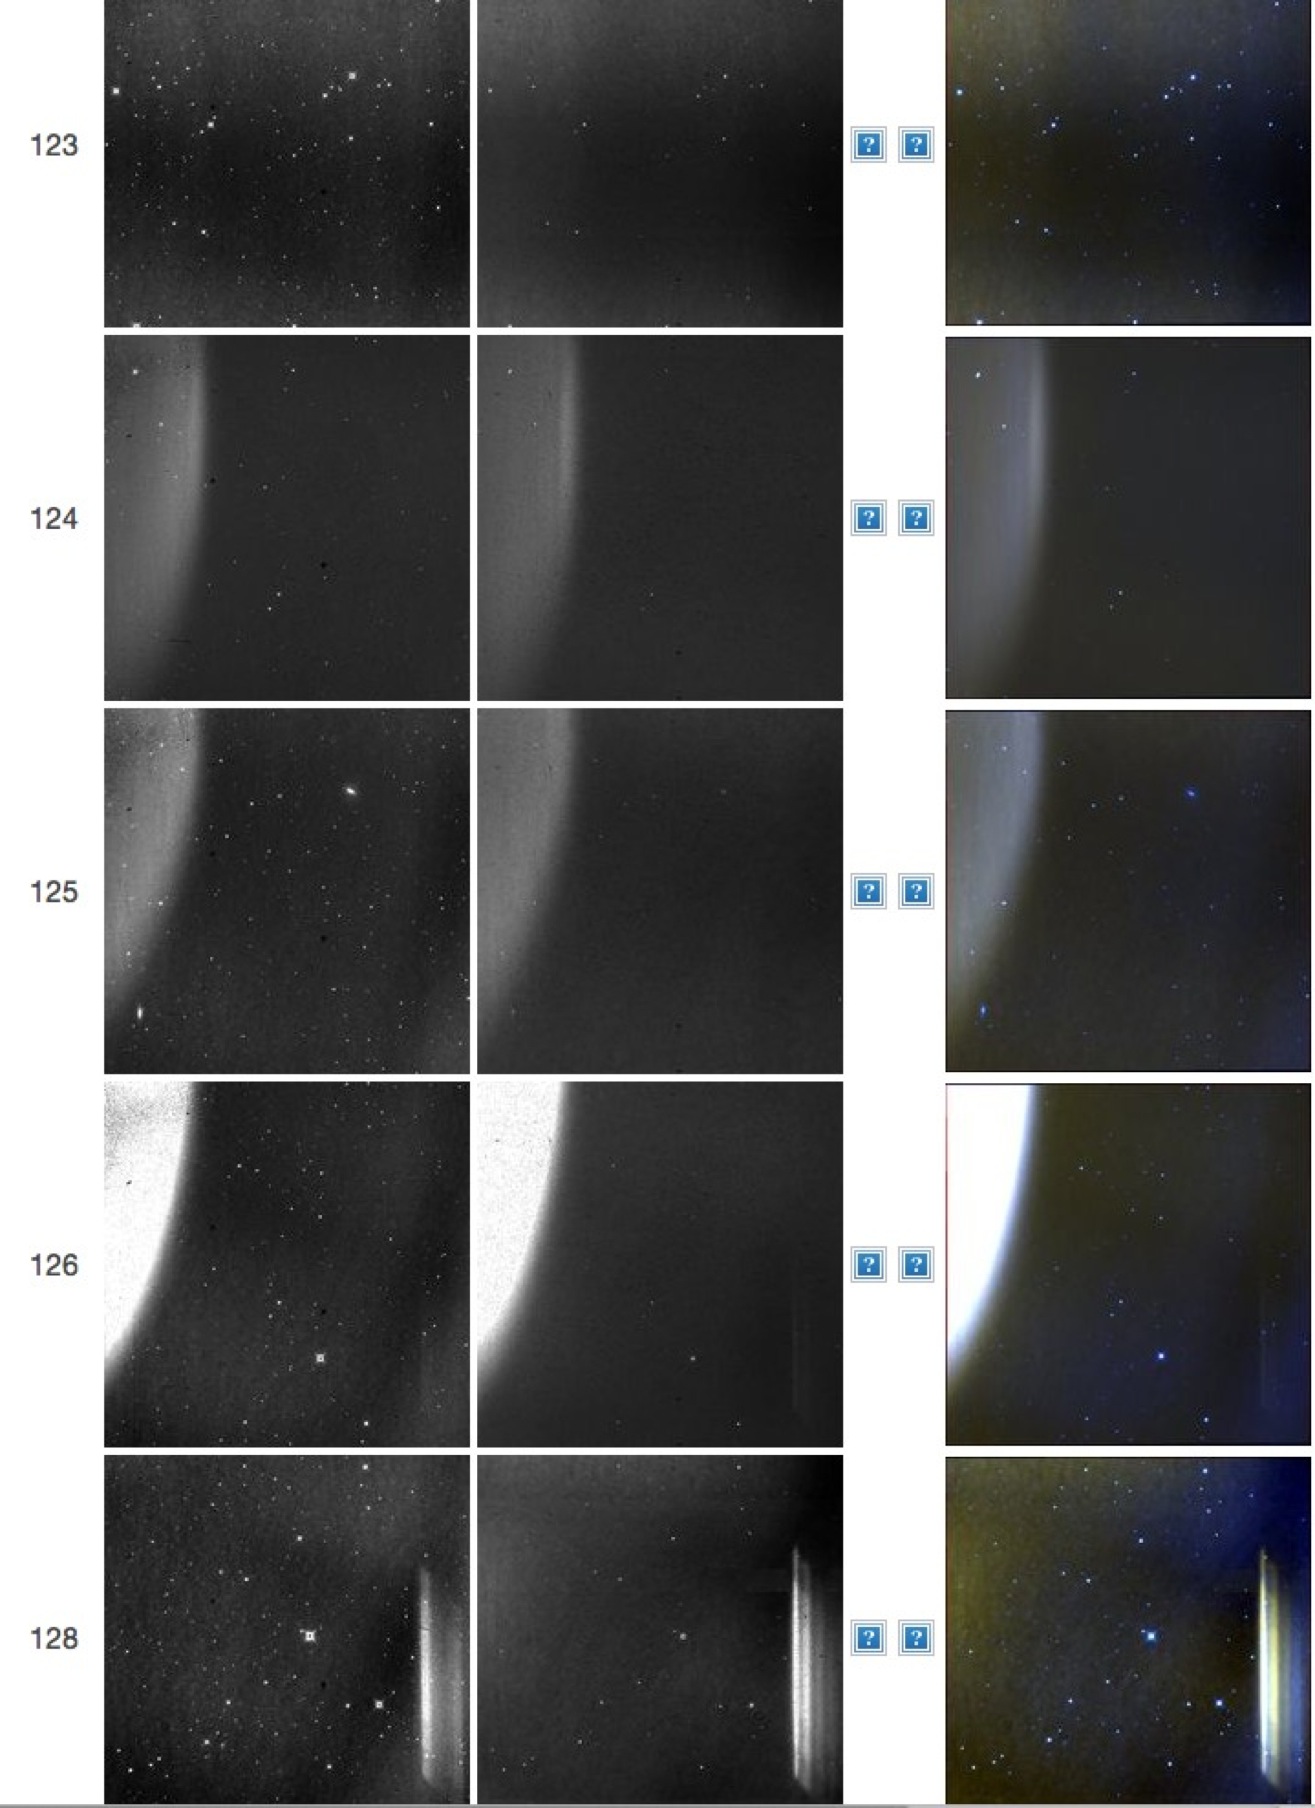
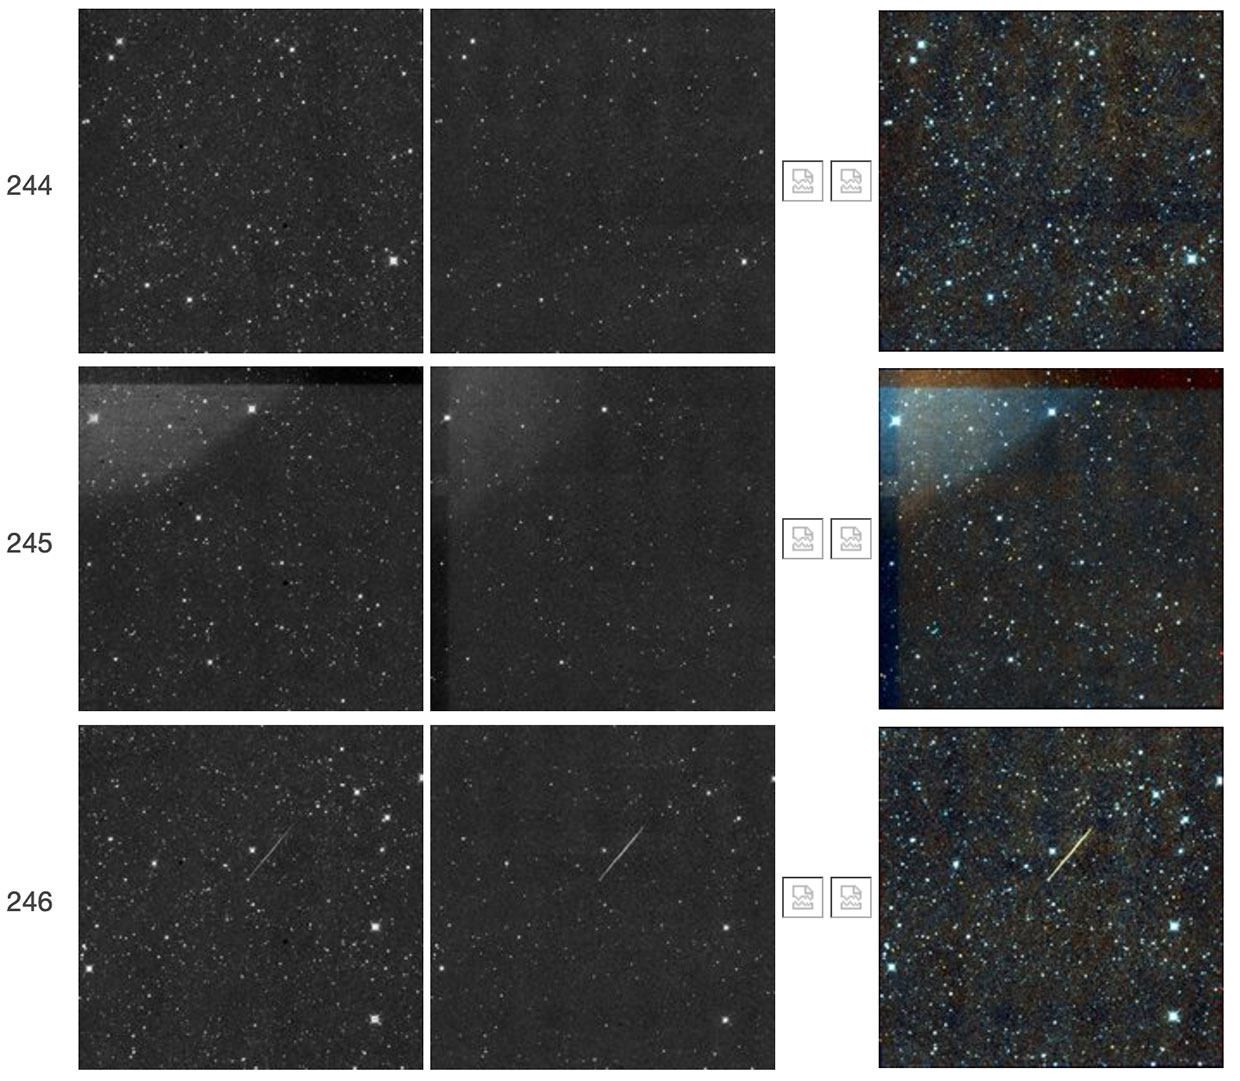
| Figure 37 - Single-exposure framesets 61181a123-128.
Many of the patterns of stray moonlight seen in NEOWISE Reactivation are
similar to those seen in earlier data releases. This example is unusually
prominent; the curved feature at the upper-left corner of framesets 124-126,
particularly strong in the latter, is not present in 128, but is instead
replaced by vertical "bars" in the right-hand side. |
Effects from Bright Objects: Possible close fly-bys
 |
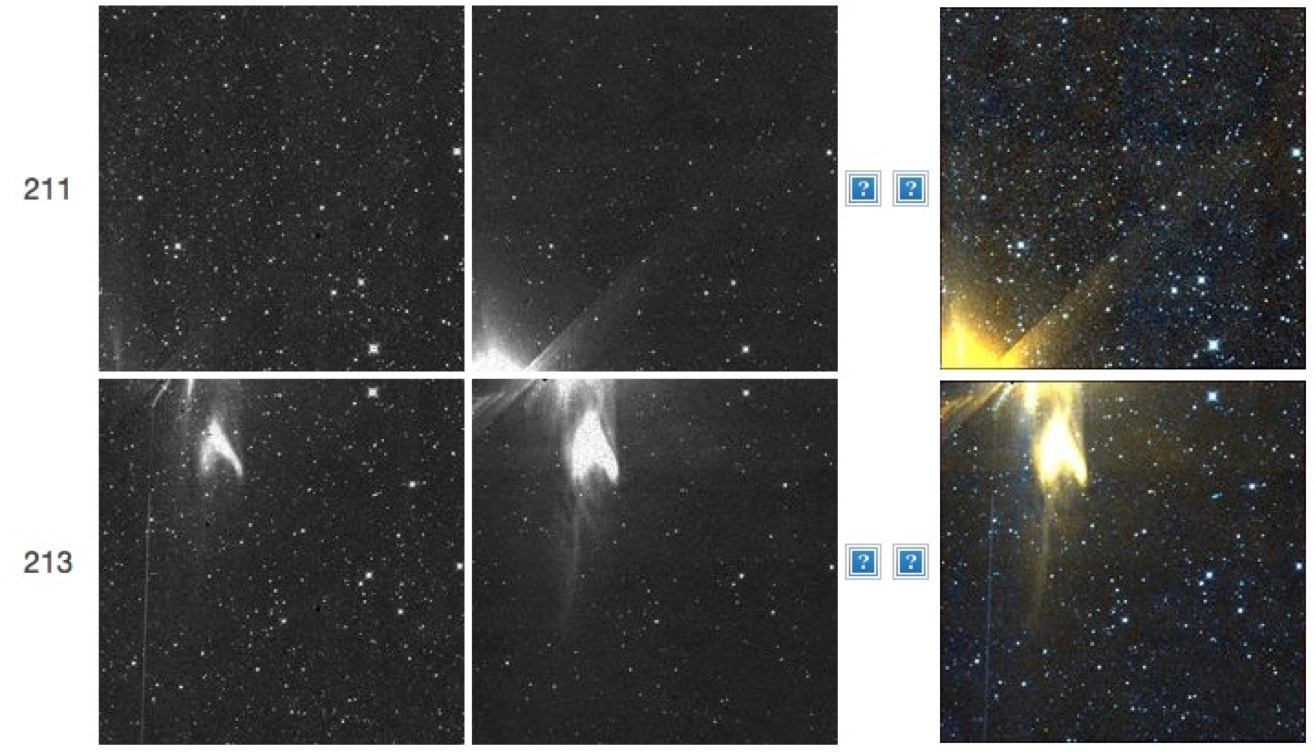
| Figure 38 - Single-exposure framesets 62256a211-213.
The "right-angle"-like glow in mainly the W2 array in 211, and an unusual
"tooth-shaped" glint in 213, are likely due to a very bright object moving
just off the fields of view during the fly-back of the scan mirror. |
 |
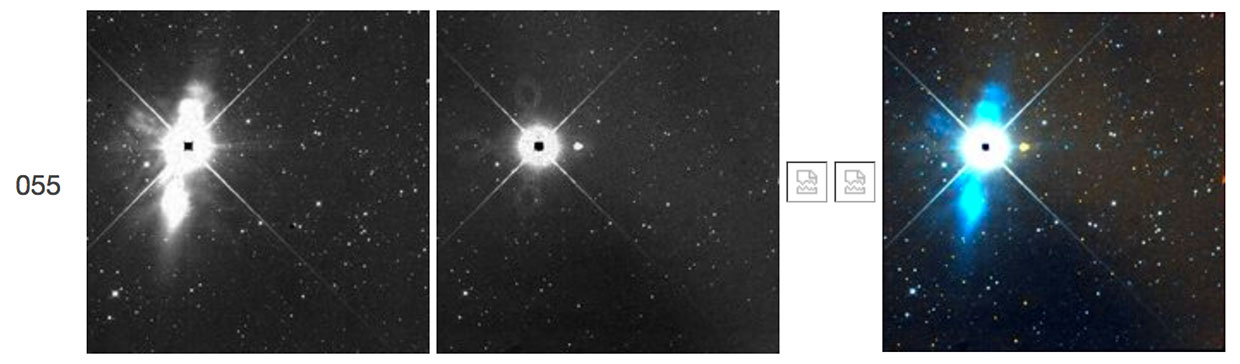
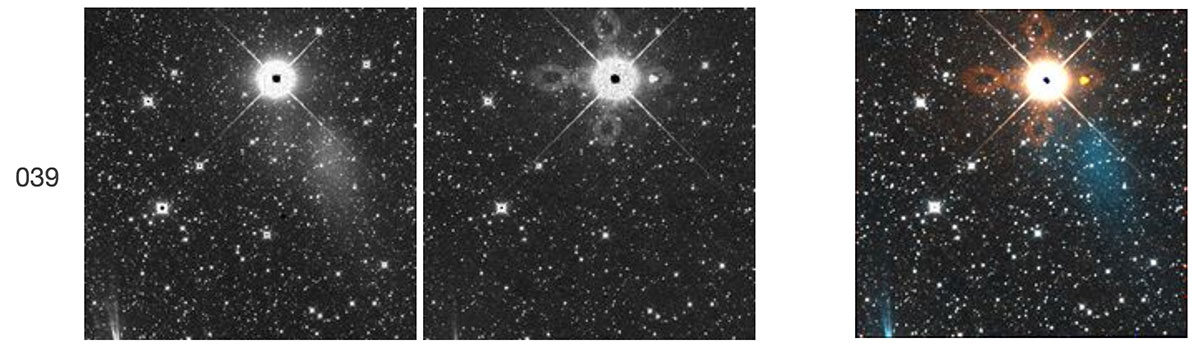
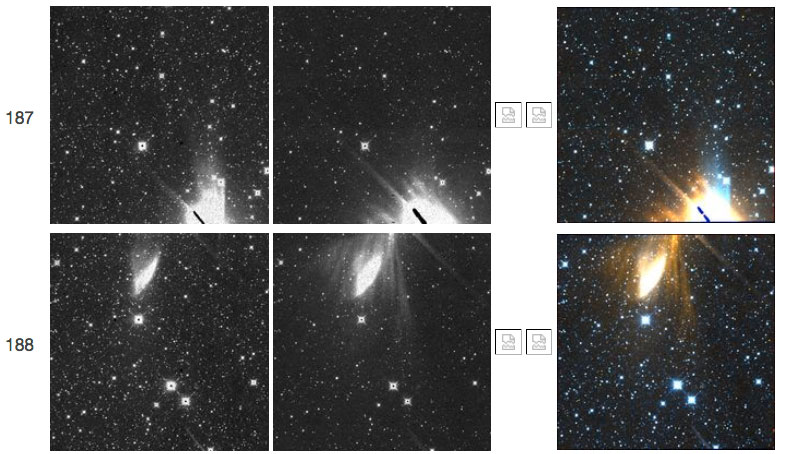
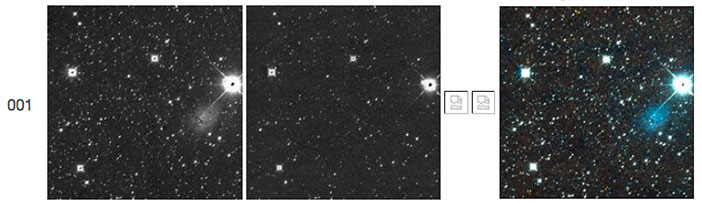
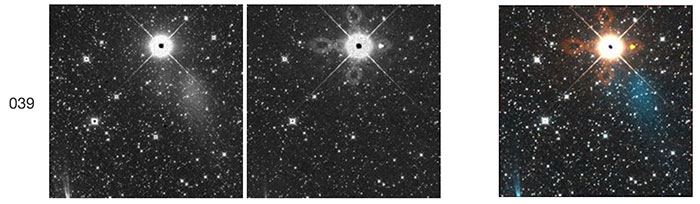
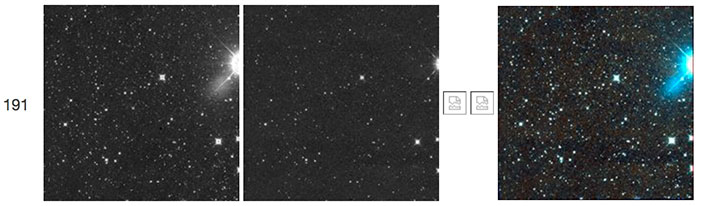
| Figure 39 - Single-exposure framesets 87752a187-188.
Frameset 188 shows a bright glint from the very bright satellite moving through the field of view in frameset 187. |
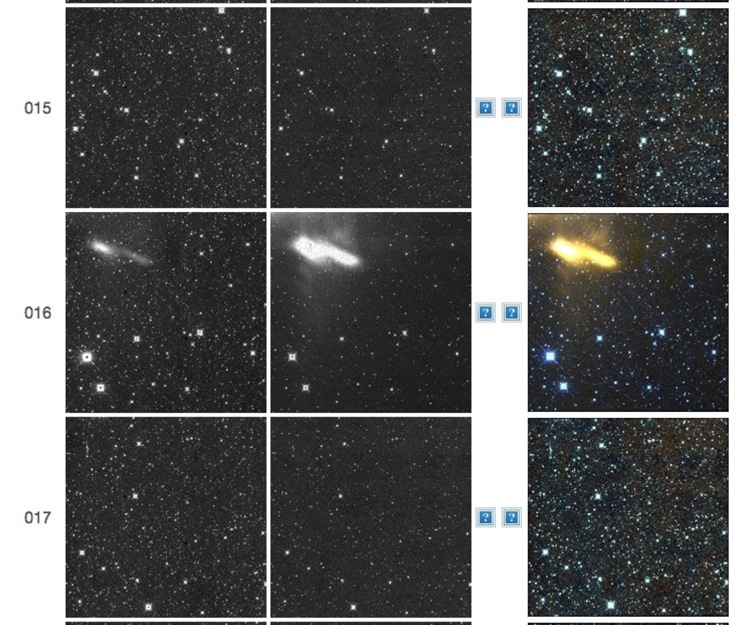 |
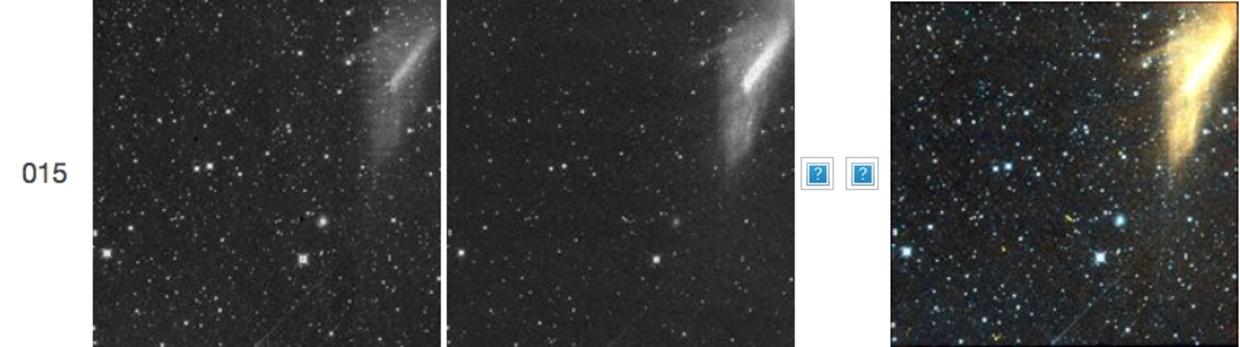
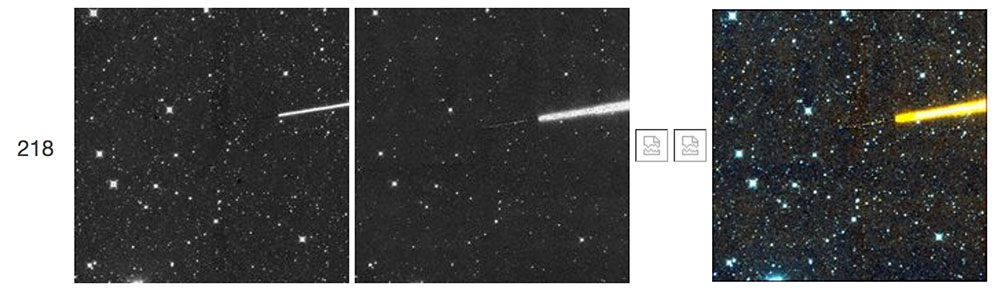
| Figure 40 - Single-exposure framesets 59797b015-017.
The bright feature towards the upper-left corner of frameset 016, shaped like
a "hairbrush," is likely due to glints from one or more bright moving
object(s) just outside of the field of view. |
 |
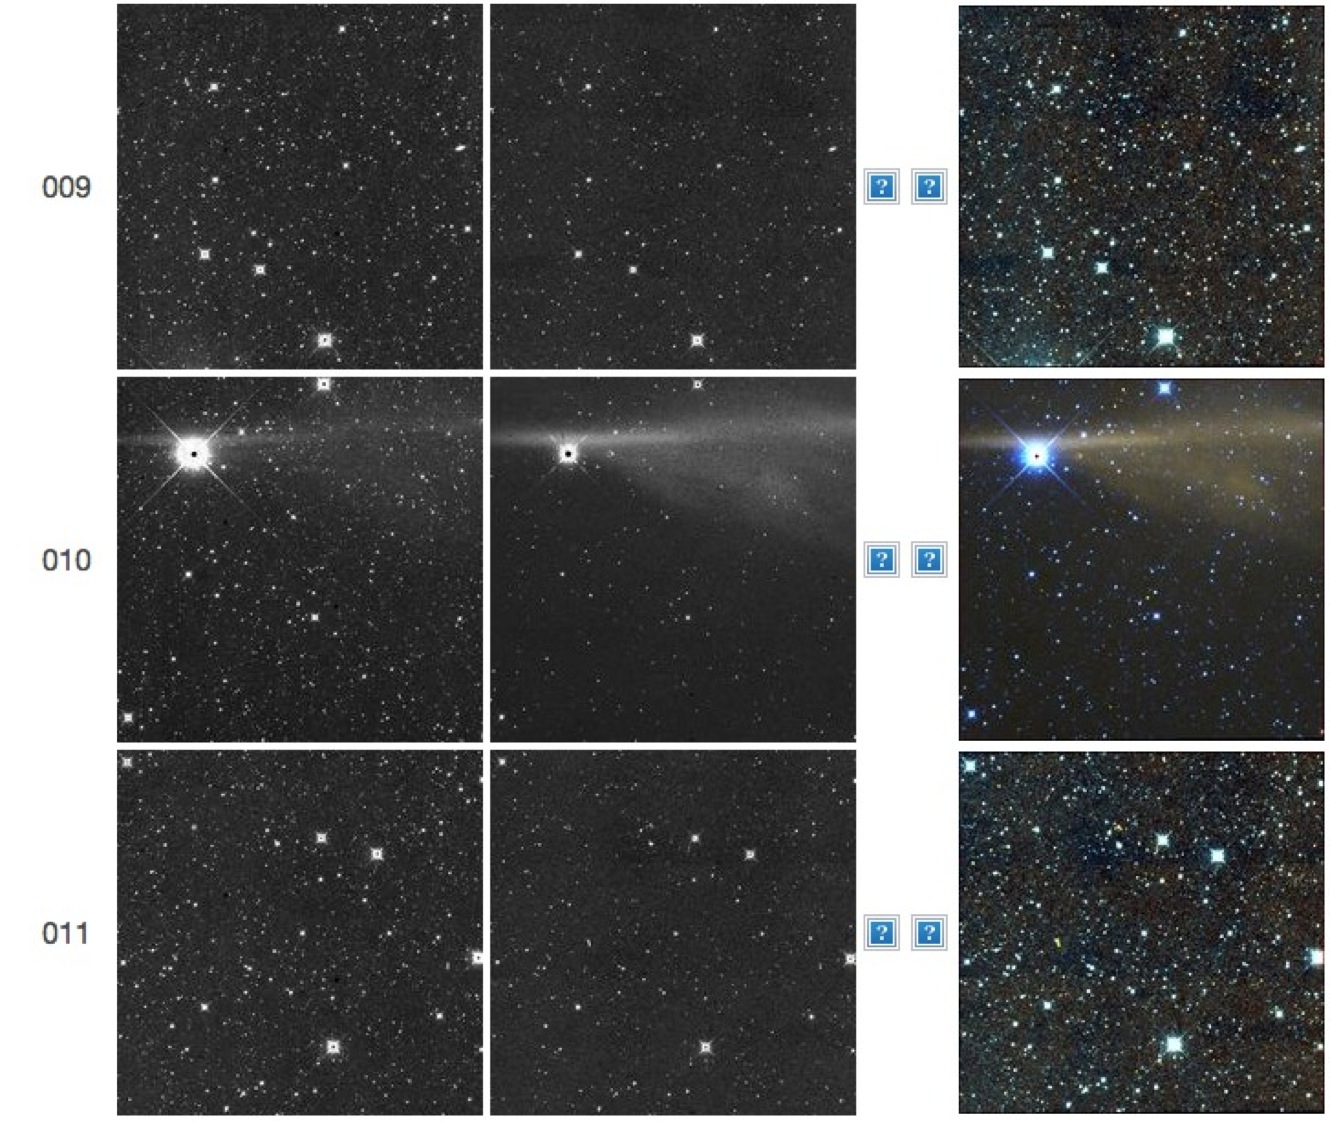
| Figure 41 - Single-exposure framesets
64993a009-011. The extended diffuse feature in frameset 010 is possibly
related to an object that passed just outside our field of view. The
feature is not seen in any other scan. |
 |
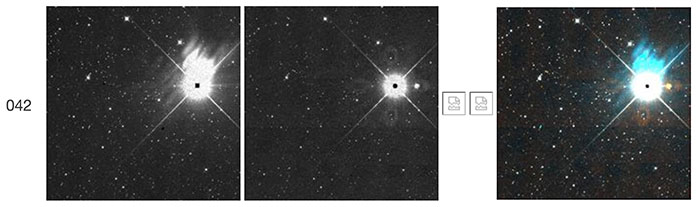
| Figure 42 - Single-exposure frameset 76409b015. The
bright extended feature, of very unusual appearance, is possibly
related to an object that passed just outside our field of view. |
 |
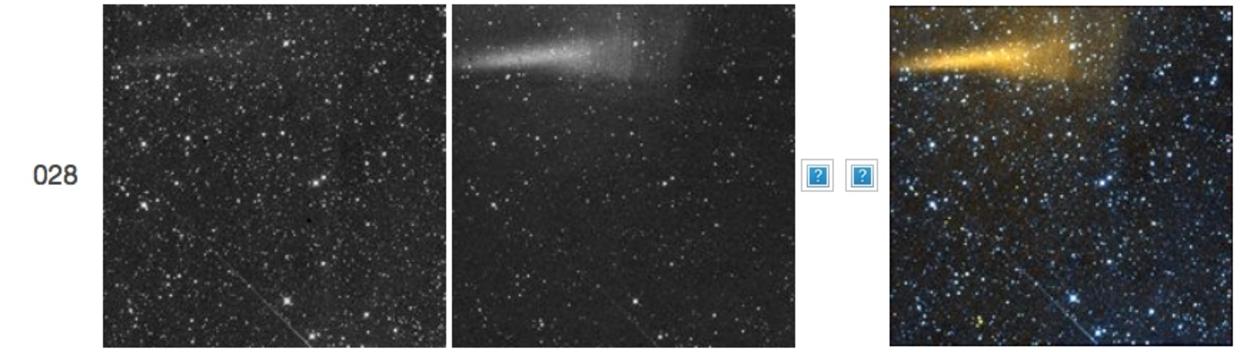
| Figure 43 - Single-exposure frameset 74800a028.
The red, "spray"-like feature, is possibly related to an object that
passed just outside our field of view. |
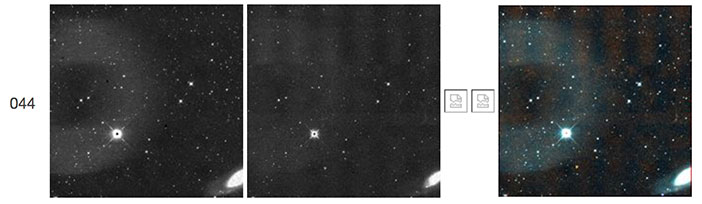
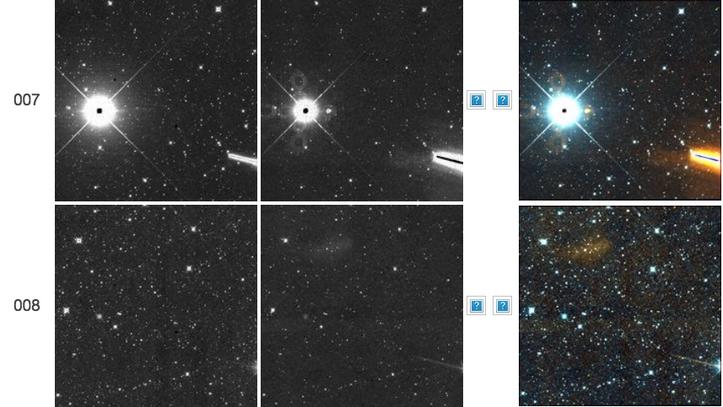 |
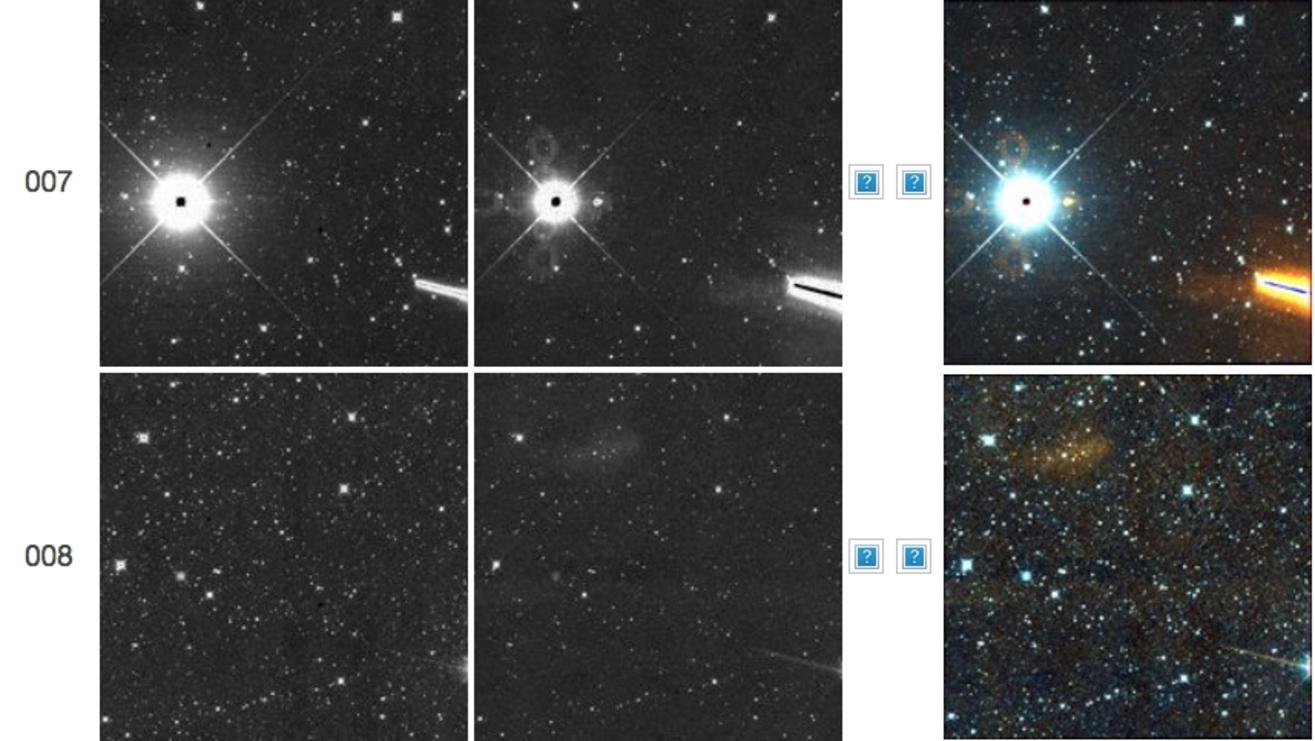
| Figure 44 - Single-exposure framesets
76421a007-008. The smeared feature in 008 is possibly a glint from the
bright moving object trail on the right in 007, and
not from the star image to the left. |
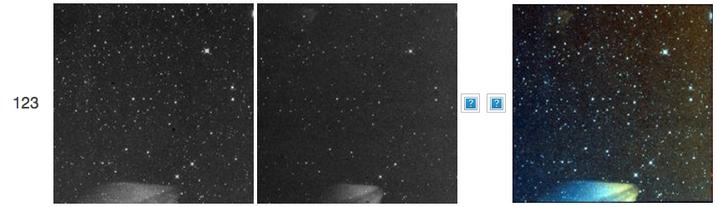 |
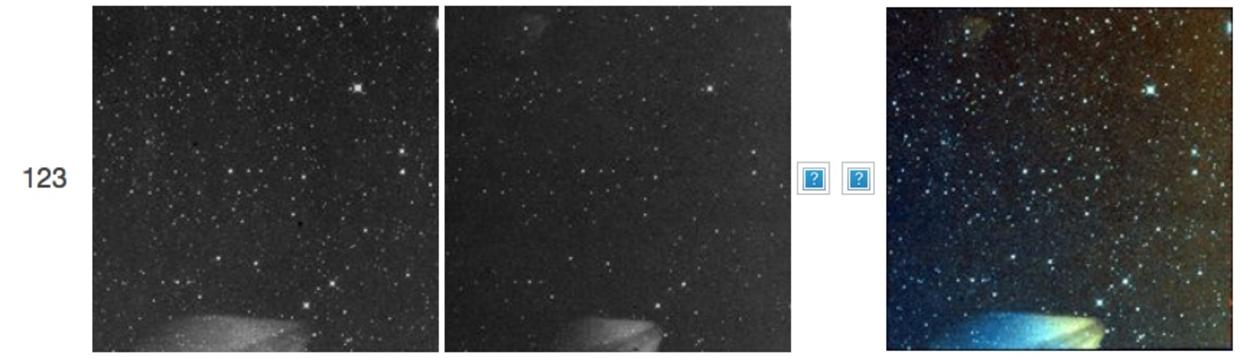
| Figure 45 - Single-exposure framesets
71737b122-125. The double-fan-like feature in 122 is very unusual and of
unknown origin. It is possibly related to an object that passed just
outside the field of view. |
 |
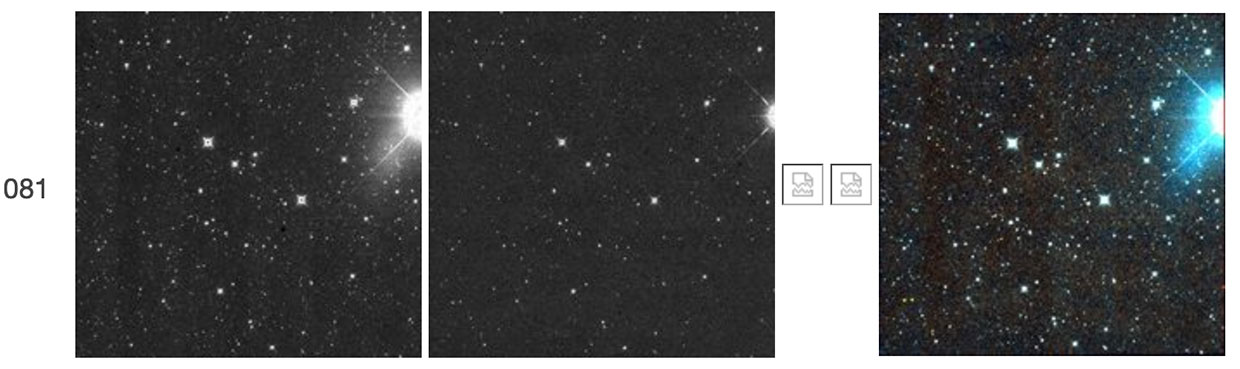
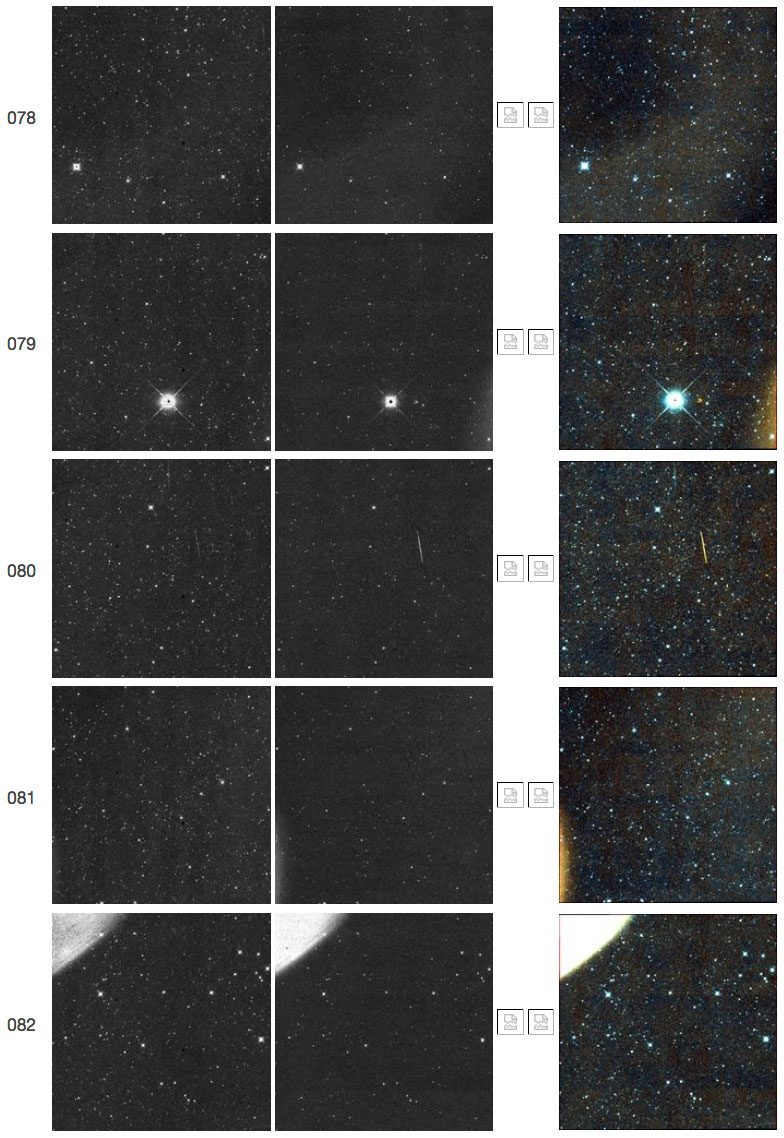
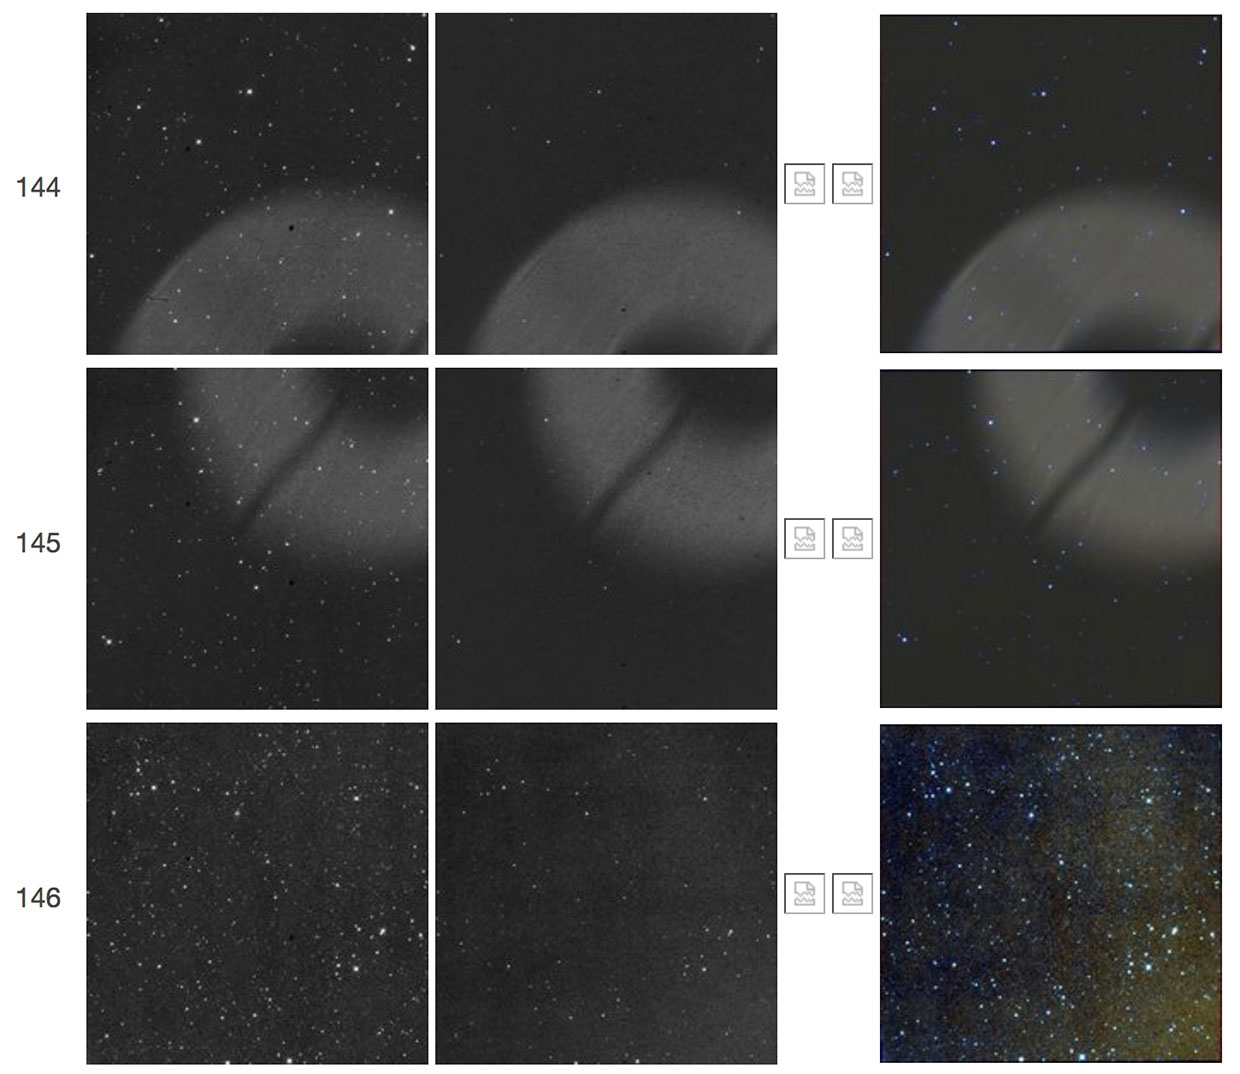
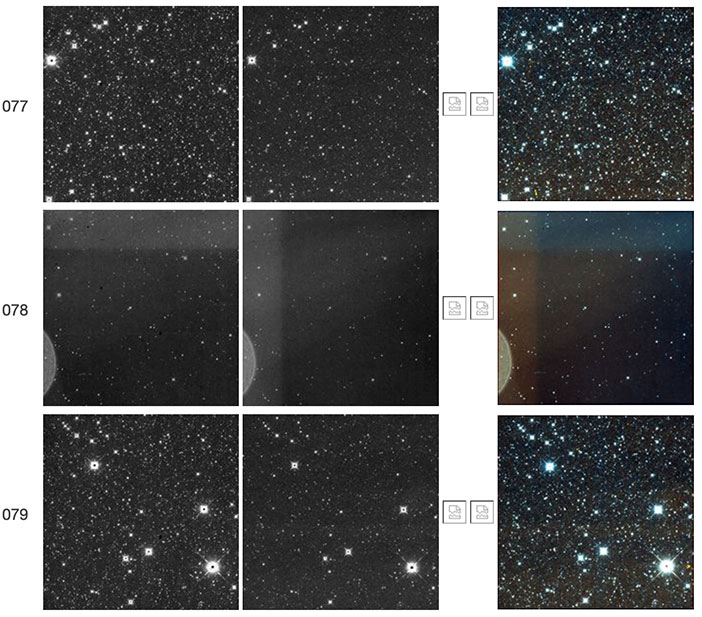
| Figure 46 - Single-exposure framesets
77530a078-082. Nearby, out-of-focus debris passes through the field of
view, as seen by the large (but faint) doughnut-shaped detection in
frameset 078, edge glows in 079 and 081, and the bright out-of-focus
smear in 082. |
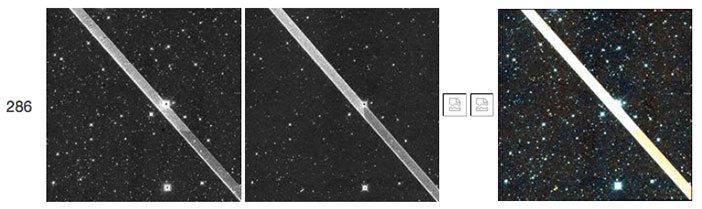 |
| Figure 47 - Single-exposure framesets 80599a286. An out-of-focus object moves through the field of view. |
 |
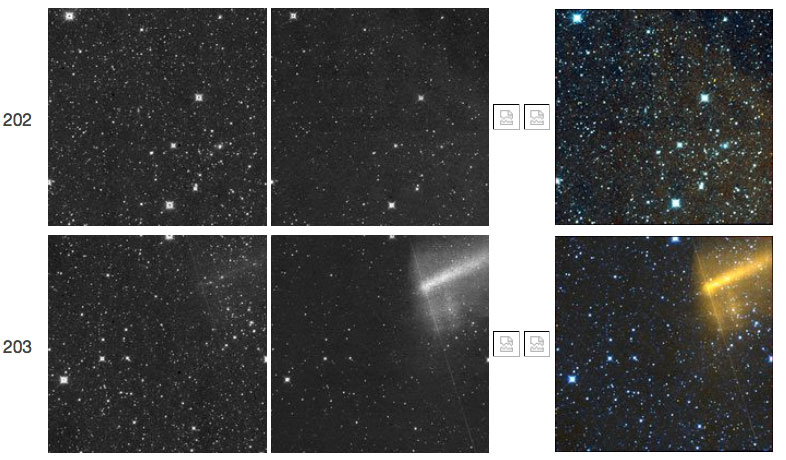
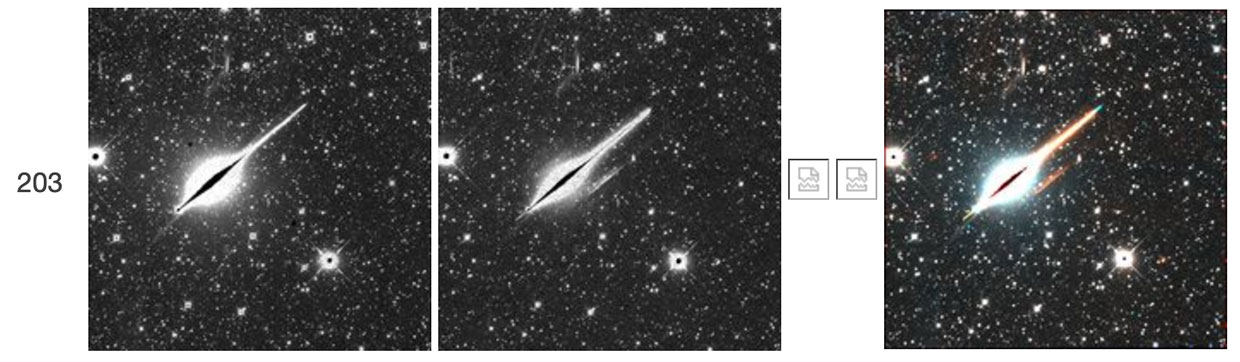
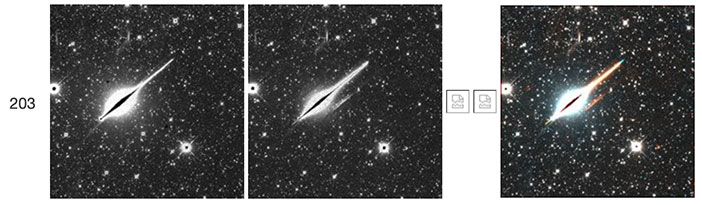
| Figure 48 - Single-exposure framesets
84067a202-203. The W2-bright trail seen here in frameset 203 may be
caused by nearby, out-of-focus debris in the field of view. |
 |
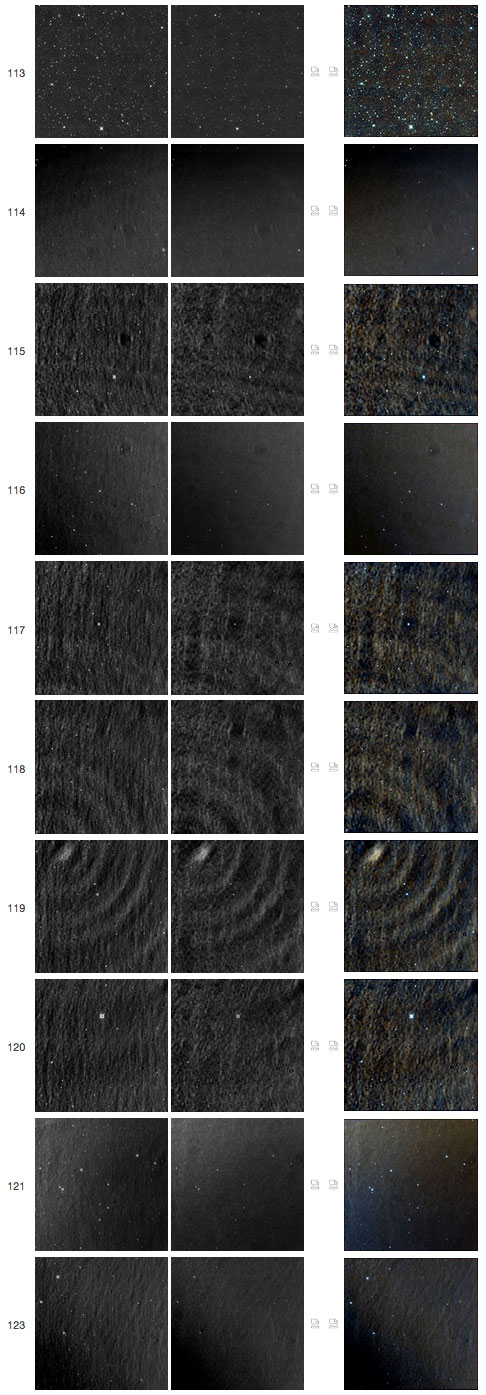
| Figure 49 - Single-exposure framesets
84600a113-123. This sequence shows a rather dramatic rise in background
levels, presumably caused by an extremely bright object just outside of
the field of view for many of these framesets. Note the highly unusual
ringlets in framesets 118 and 119. |
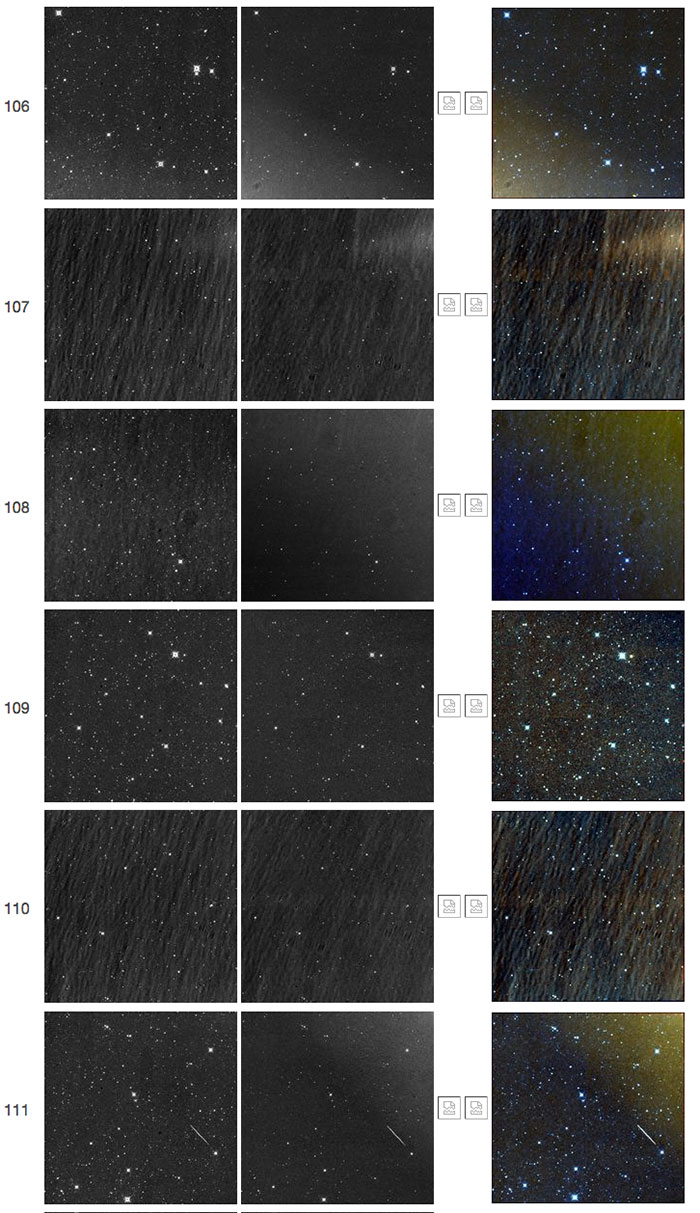 |
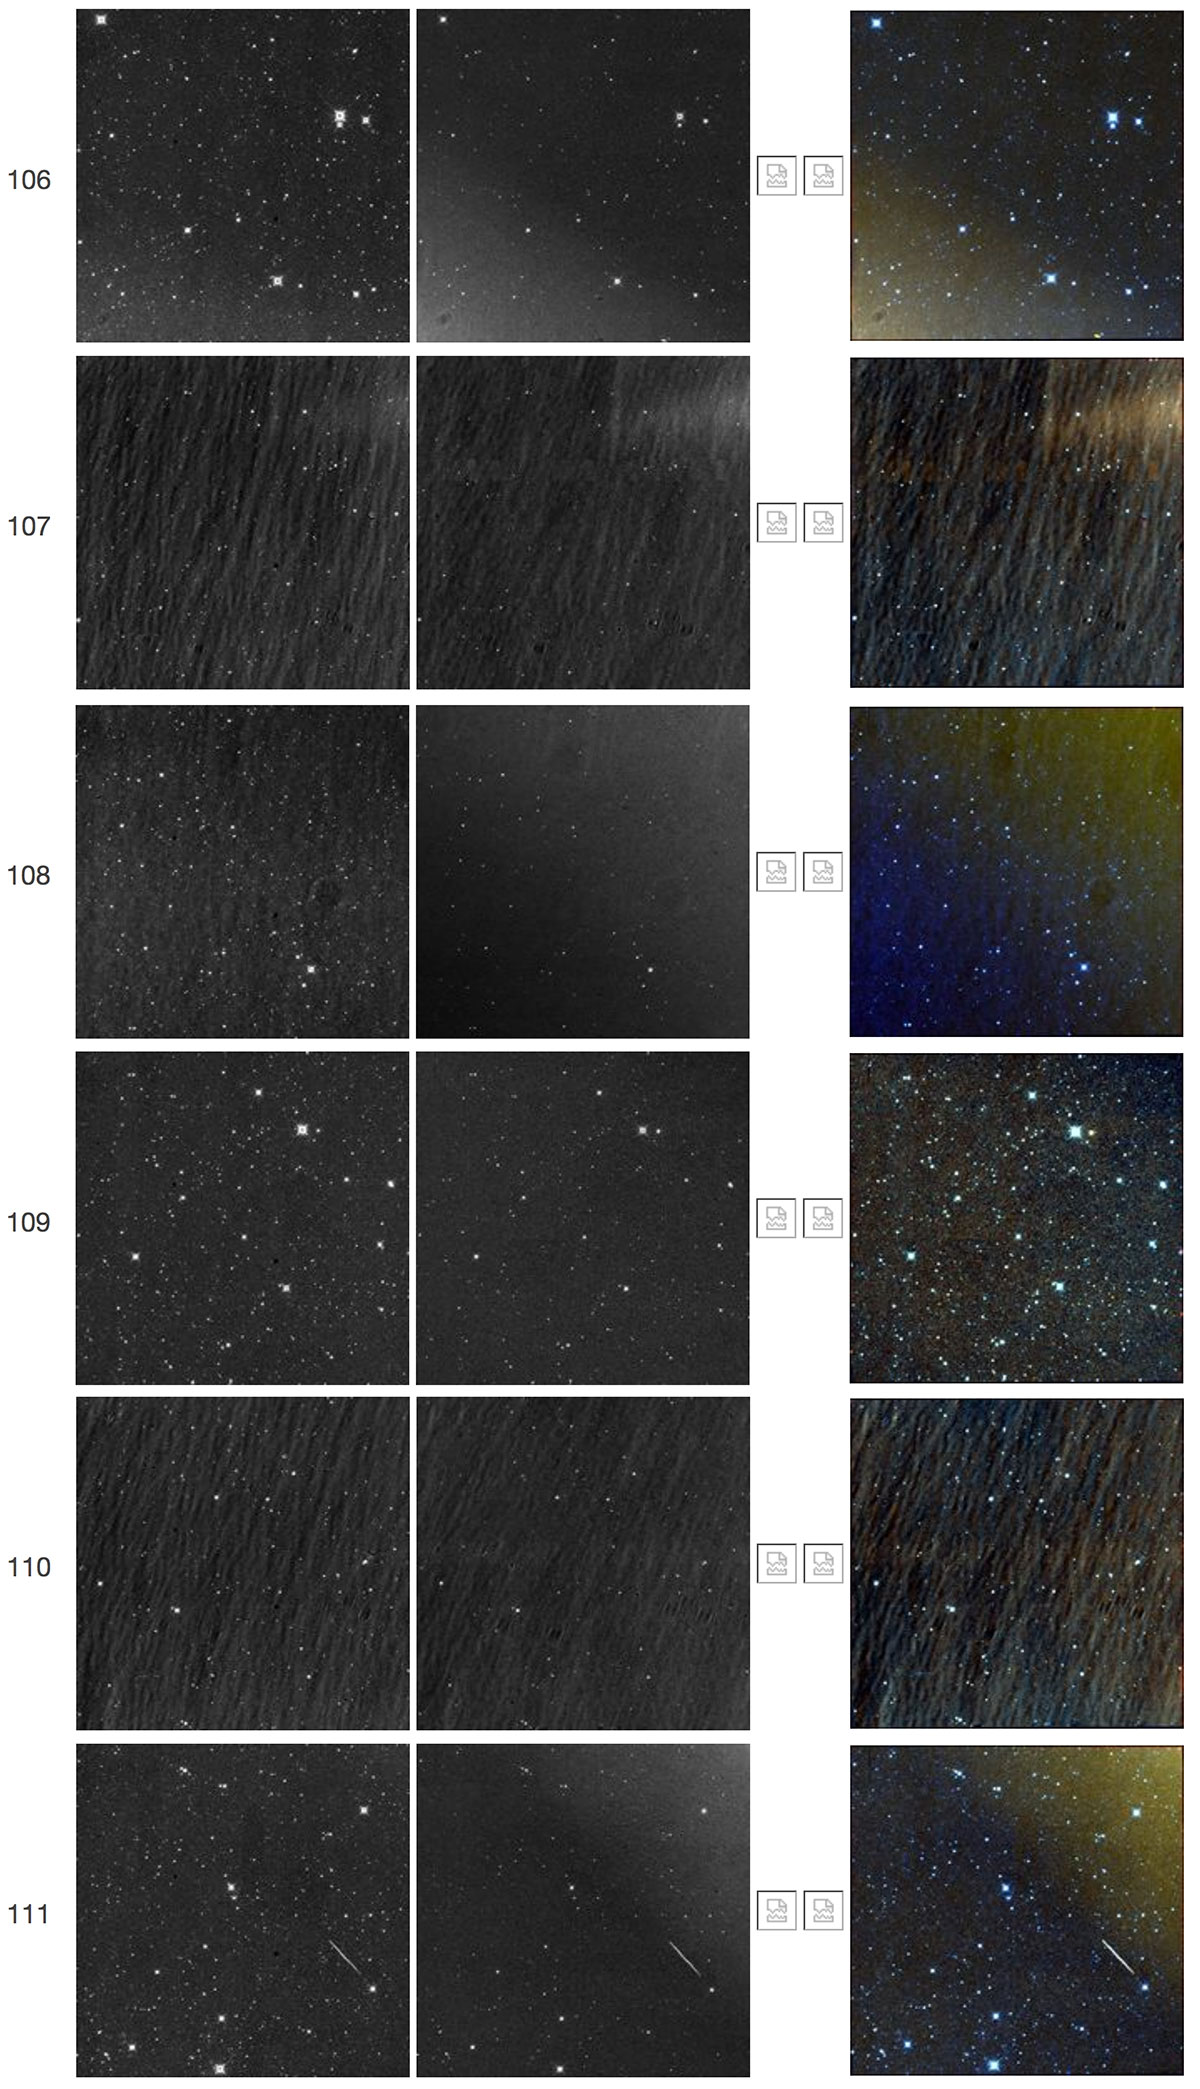
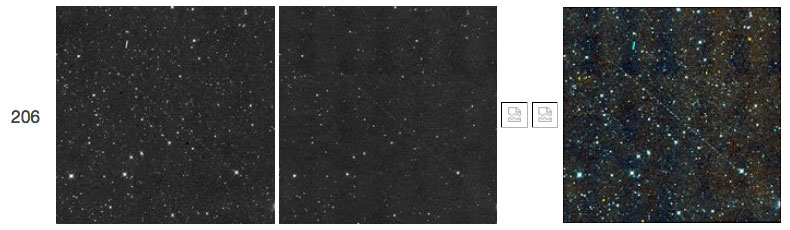
| Figure 49b - Single-exposure framesets
94688a106-111. This sequence shows another dramatic rise in background
levels, presumably caused by an extremely bright object just outside of
the field of view for many of these framesets. Note that although the
pattern resembles ordinary Moon glow, the Moon was about 113 degrees
away. |
 |
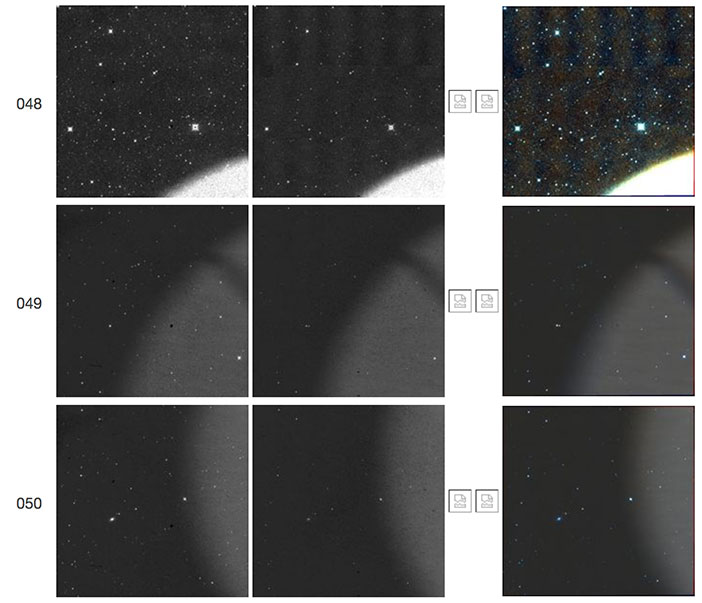
| Figure 50 - Single-exposure framesets
87578a066-068. Frameset 067 shows a smeared "doughnut", a telltale sign
of a nearby, out-of-focus source moving through the field of view. |
 |
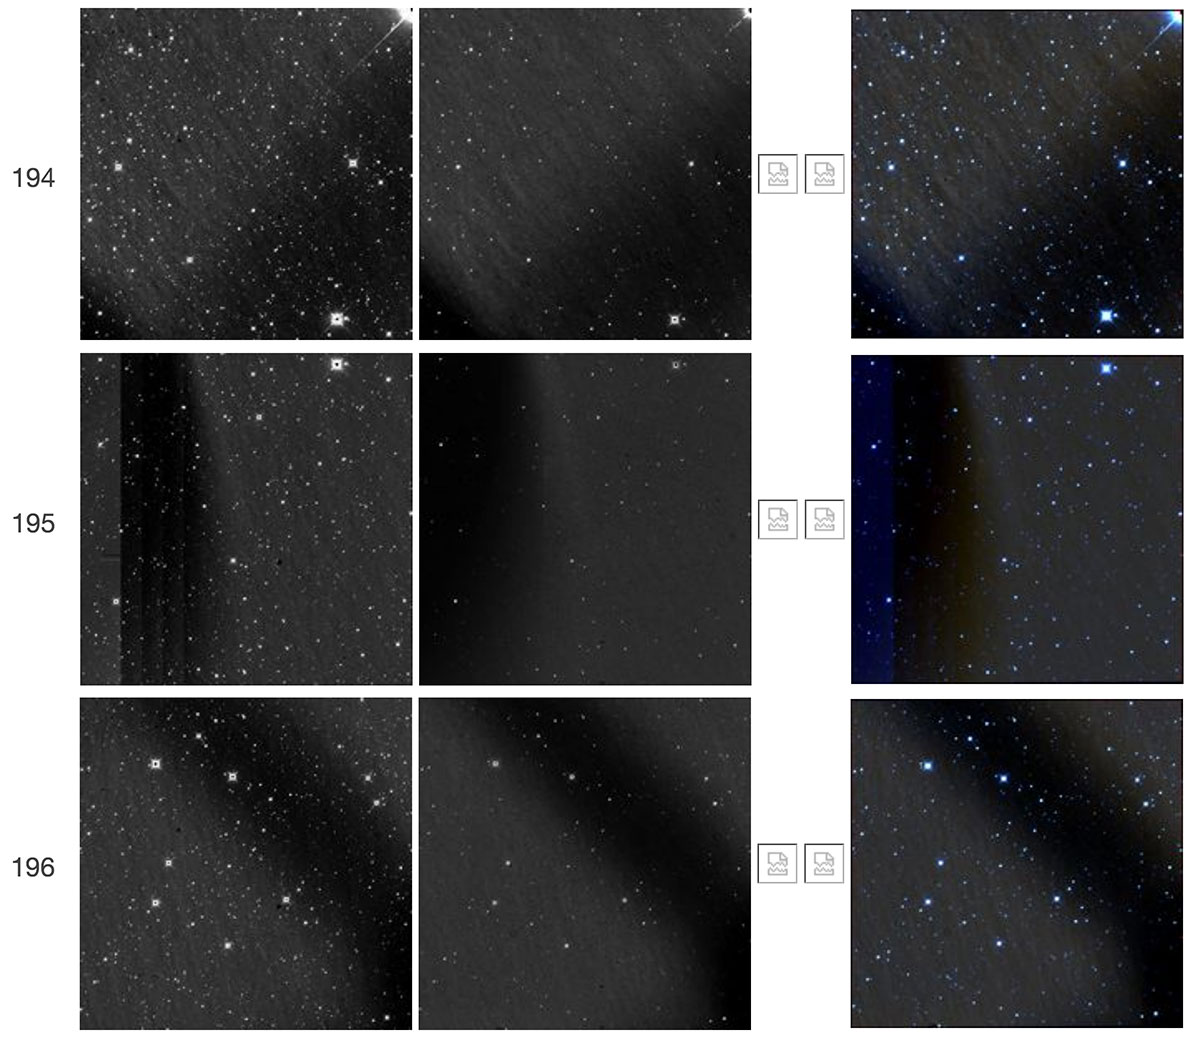
| Figure 50a - Single-exposure framesets
16440r195-196. Frameset 196 shows another example of a smeared
"doughnut," a telltale sign of a nearby, out-of-focus source moving
through the field of view. In this case the feature is vertical. |
 |
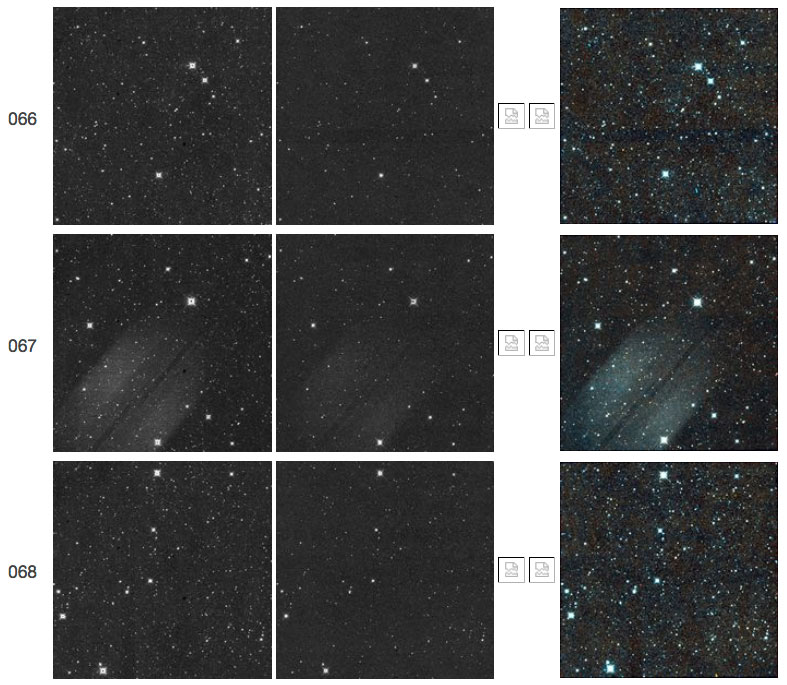
| Figure 50b - Single-exposure framesets
21734r194-196. These framesets show glow patterns from one or more
"doughnuts," telltale signs of one or more nearby, out-of-focus sources
moving through the field of view. |
 |
| Figure 50c - Single-exposure frameset 21734r201.
Another example of a smeared "doughnut," a telltale sign of a nearby,
out-of-focus source moving through the field of view. This object is
seen shortly after the out-of-focus object(s) in Figure 50b. |
 |
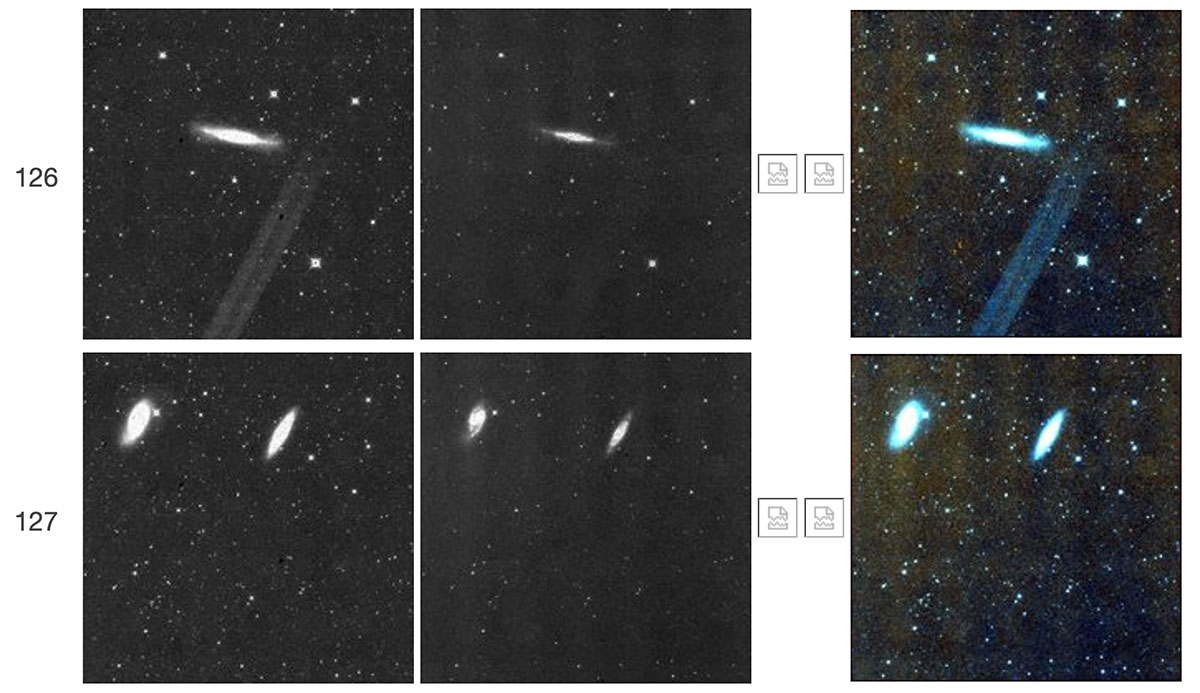
| Figure 50d - Single-exposure framesets
23214r126-127. Frameset 126 shows a smeared "doughnut", a telltale sign
of a nearby, out-of-focus source moving through the field of view.
Framesets 126 and 127 contain the interacting galaxies known as the Leo
Triplet. |
 |
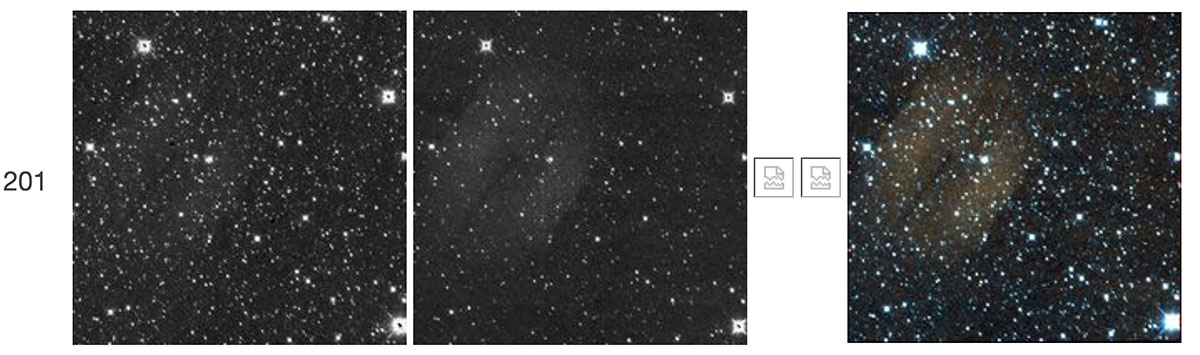
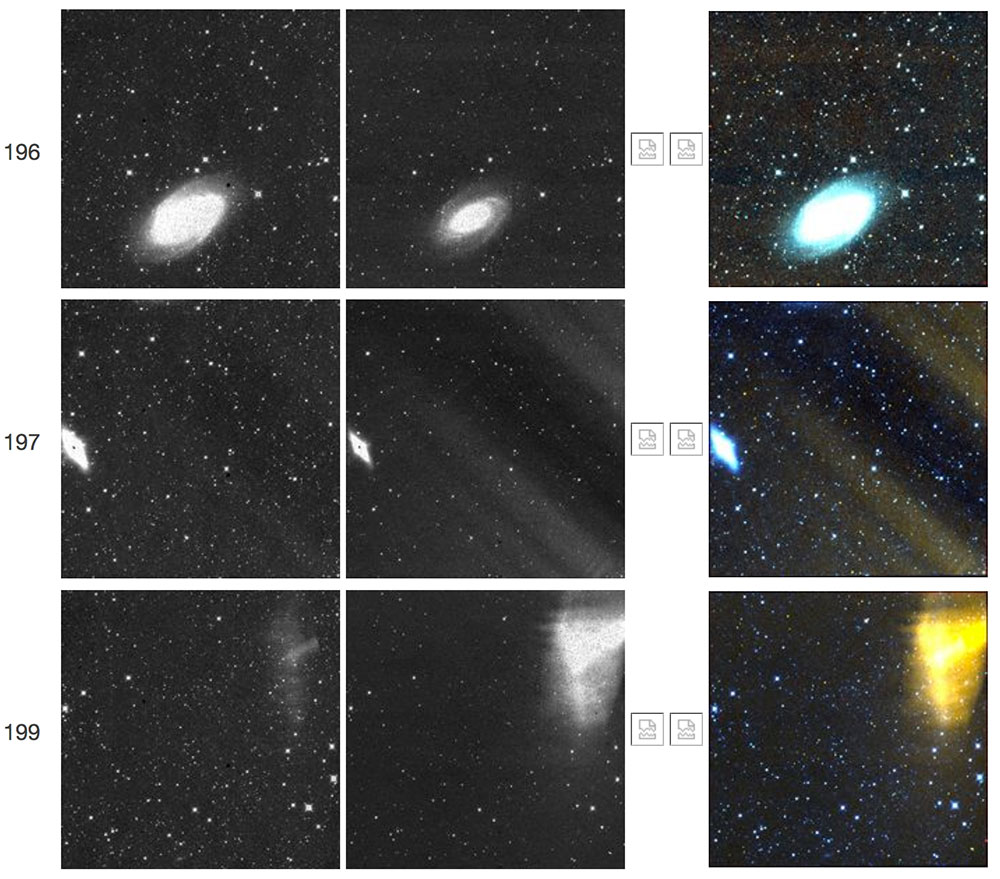
| Figure 50e - Single-exposure framesets
91993a197-199. Frameset 197 shows a slightly smeared "doughnut", a
telltale sign of a nearby, out-of-focus source moving through the field
of view. Frameset 199 shows a smeared glint, most likely also from this
moving source. The two galaxies in these images are M81 and M82. |
 |
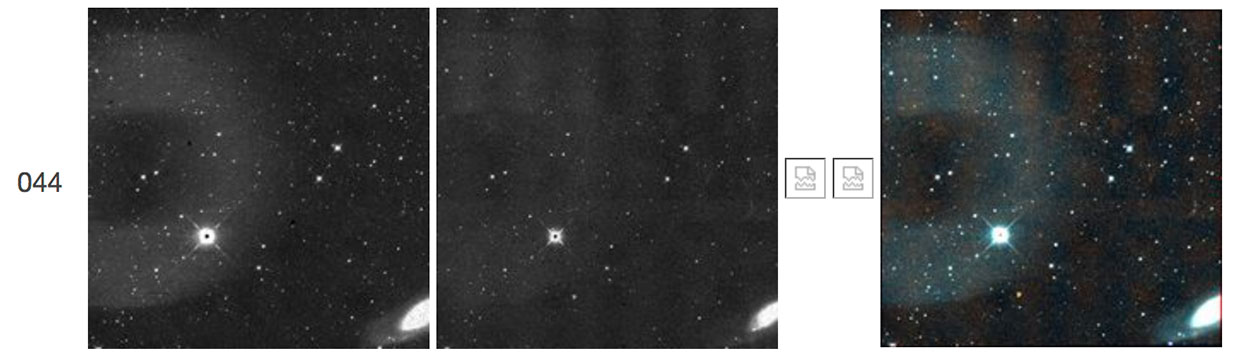
| Figure 50f - Single-exposure frameset 11960r044.
This frameset shows another smeared "doughnut" -- another nearby,
out-of-focus source moving through the field of view. The galaxy at
lower right is M106. |
 |
| Figure 50g - Single-exposure frameset
11960r048-050. These framesets show another out-of-focus source moving
through the field of view. This sequence occurs shortly after the
out-of-focus object seen in Figure 50f. |
 |
| Figure 50h - Single-exposure frameset
29492r144-146. Framesets 144-145 show another out-of-focus source moving
through the field of view. Other framesets in this scan, such as 146,
exhibit mild Moon glow. This scan exhibits an instance of the "resonant"
pixel effect in earlier framesets, shown in Figure 18l of section III.2.c.ii. |
 |
| Figure 50i - Single-exposure framesets
39506r077-079. Frameset 078 shows another "doughnut" on the
left-hand-side edge---another nearby, out-of-focus source in the field
of view. The sharp edge of the "doughnut" suggests the source is not
moving as fast as in other instances and is not being smeared out. A "TV
test pattern" is also present in the frameset. The preceding (077) and
following (079) framesets do not exhibit any unusual feature. |
 |
| Figure 50j - Single-exposure frameset 51839r244-246.
Frameset 245 shows a "TV test pattern" with mild signal jumps. Interestingly, the
area to the upper left of the frameset indicates the presence of a close, out-of-focus
object passing just outside of the field of view. This image lends
additional evidence to the idea that the "TV test pattern" phenomenon
and fly-bys may be correlated. (See also Figure 50i.)
|
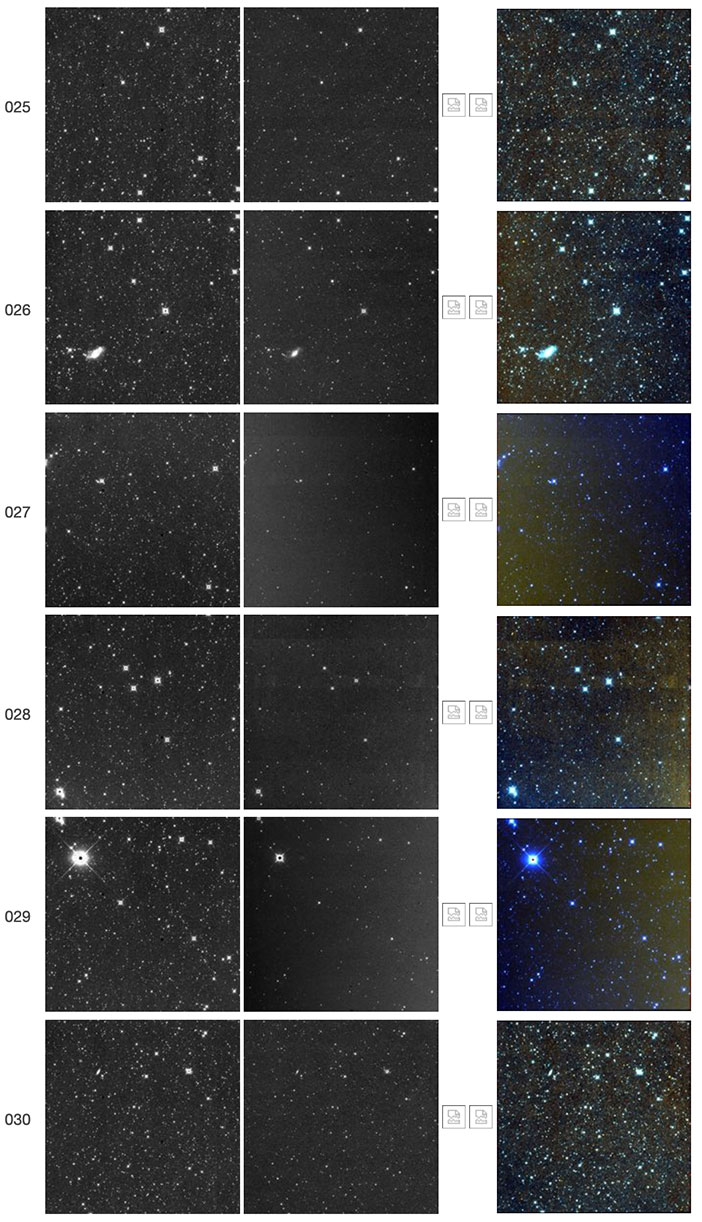 |
| Figure 50k - Single-exposure framesets
54592r025-030. Irregular background illumination, particularly in
framesets 027-029, mimics the glow seen when the Moon is just
outside the field of view. This scan, however, is on the opposite
side of the sky from the Moon, indicating that another very bright, illuminating
source, perhaps a bright satellite or a piece of space
debris, just outside the field of view is responsible. |
Effects from Bright Objects: Smeared latents from source images smeared by spacecraft maneuvers
 |
| Figure 51 - Single-exposure framesets 66917a002-006.
The W2 feature near the right-hand side is a latent from R Dor. It is smeared, because R Dor
was observed before the scan, during a spacecraft maneuver, in engineering
framesets previous to the scan, and was itself smeared. |
Effects from Bright Objects: Satellite flashes, tumbling satellites, and orbital debris
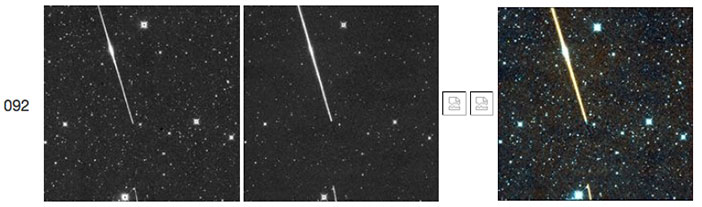 |
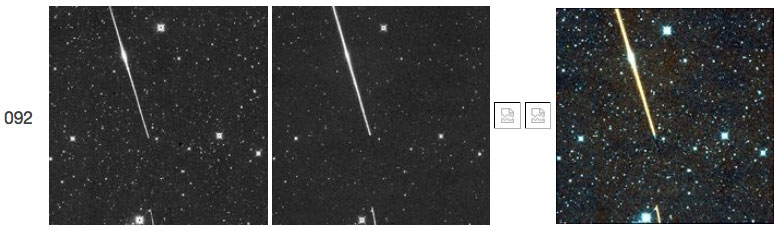
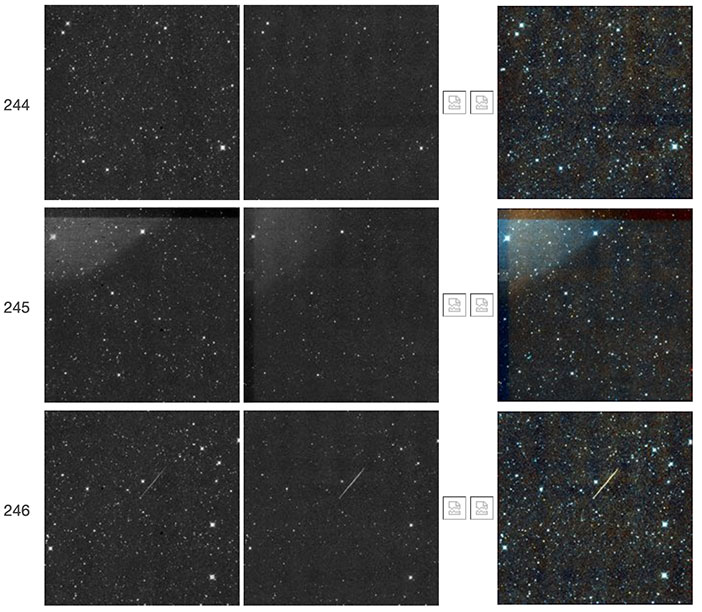
| Figure 52 - Single-exposure frameset 78992a092. These images show a satellite trail with a single, moderate flash along its course.
|
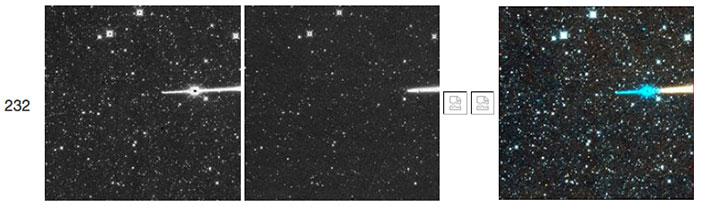 |
| Figure 53 - Single-exposure framesets 80576a232.
This satellite in this instance has a bright flash, but only on the
portion of its trail capture by the W1 array.
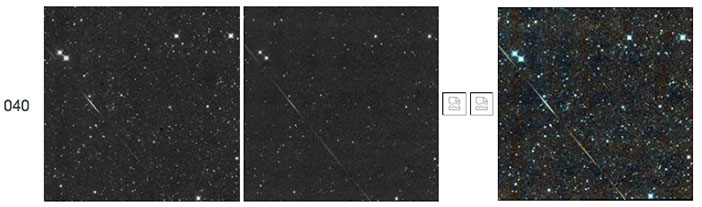
|
 |
| Figure 54 - Single-exposure frameset 81747a206.
Although not a bright effect, this rapidly tumbling satellite creates a
dotted line diagonally across most of the field of view.
|
 |
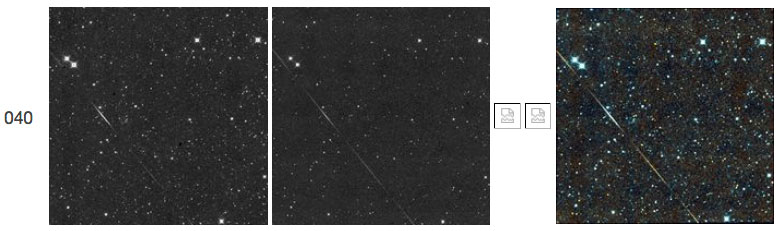
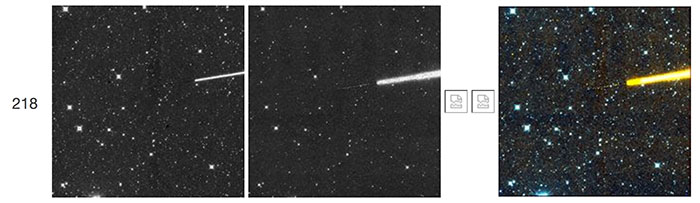
| Figure 55 - Single-exposure frameset 87508a040. This satellite has a slower tumbling rate than that in the previous example. |
 |
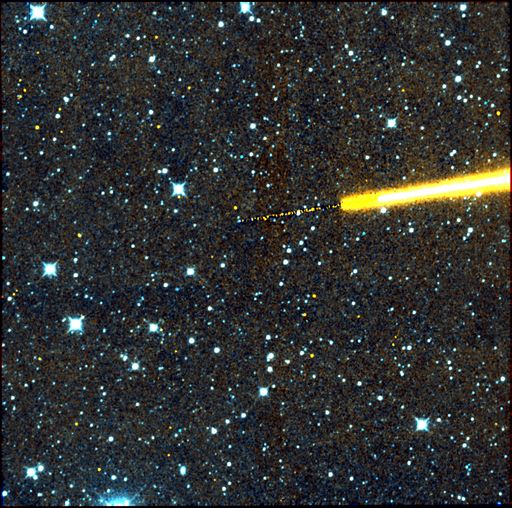
| Figure 55a - Single-exposure frameset 95197a218.
Another instance of a tumbling satellite trail. In this case, however,
the tumbling is seen in the dark segment of the trail. This dark segment
is a common phenomenon, due to read-out differential timing effects. A
detailed view is shown below. |
 |
| Figure 55b - Single-exposure frameset 95197a218. This is a zoomed-in version of the satellite trail shown in Figure 55a. |
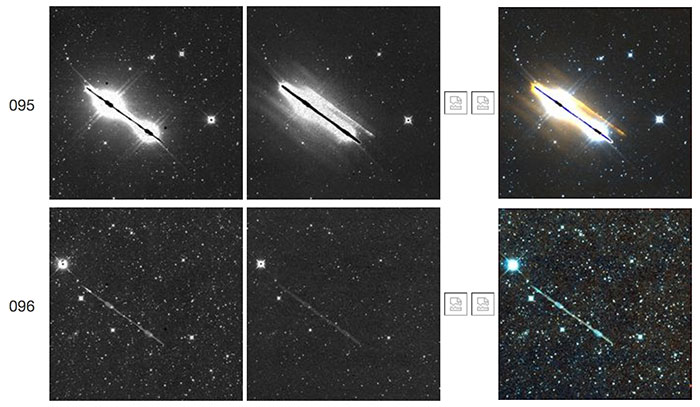 |
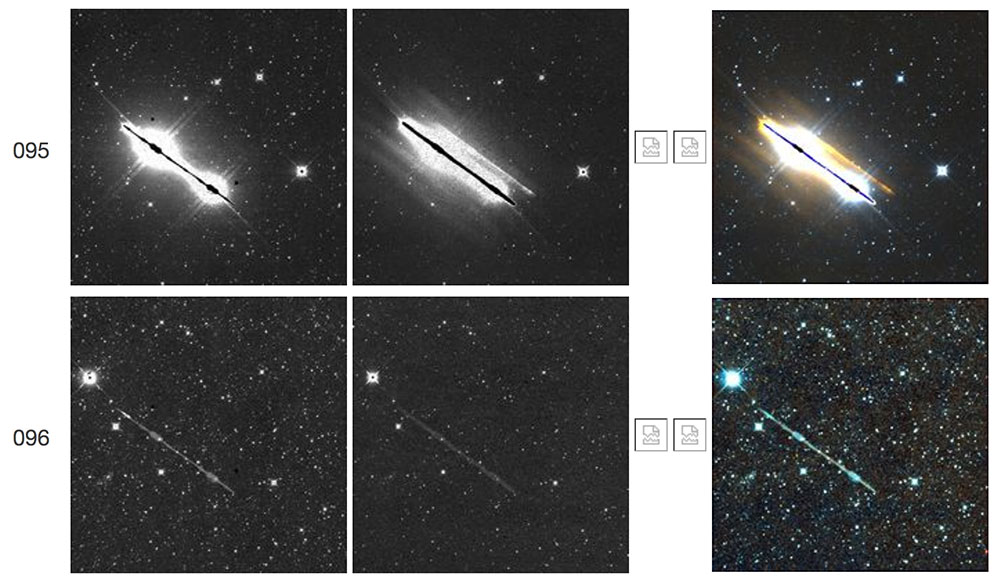
| Figure 55c - Single-exposure framesets
97991a095-096.jpg.
The bright, saturated and smeared feature with ghosts in frameset 095,
and the latent in 096 were caused by a very bright satellite. The trail
and its latent show that the satellite was tumbling. |
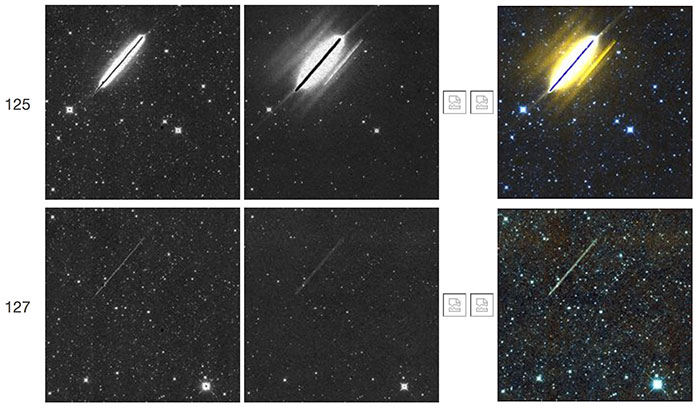 |
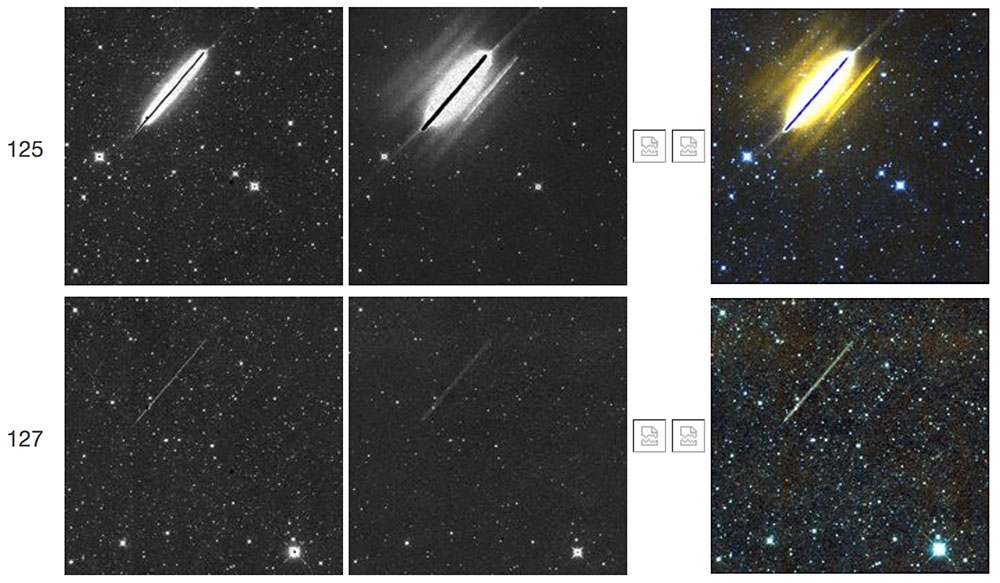
| Figure 55d - Single-exposure framesets
90026a125-127.
The bright, saturated and smeared feature with ghosts in frameset 125,
and the latent in 127 were caused by a specular reflection of sunlight
off of a high-altitude satellite. |
 |
| Figure 55e - Single-exposure frameset 35867r203.
The short trail exhibits a dramatic brightening caused by specular
reflection of sunlight off a satellite component. To the right of the
bright region in W2 is a streaked ghost, which is common for bright
sources in this band. |
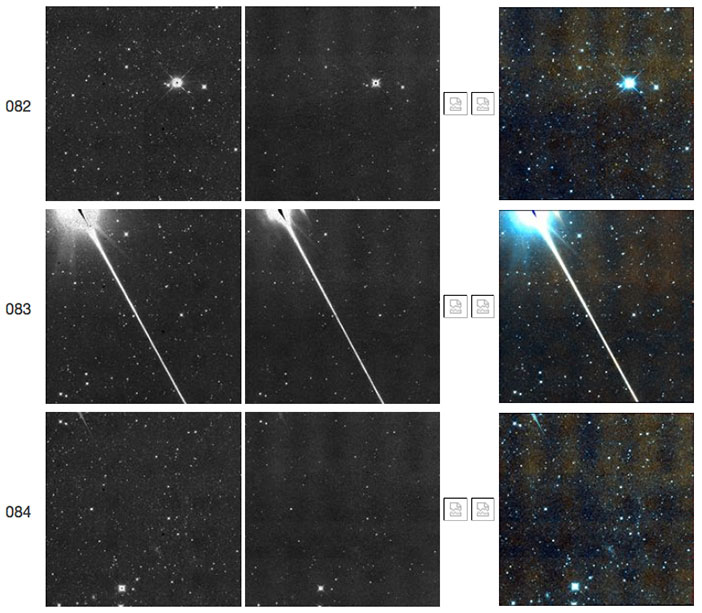 |
| Figure 56 - Single-exposure framesets 88642a082-084. This satellite trail shows a dramatic flash near the top of the field of view. |
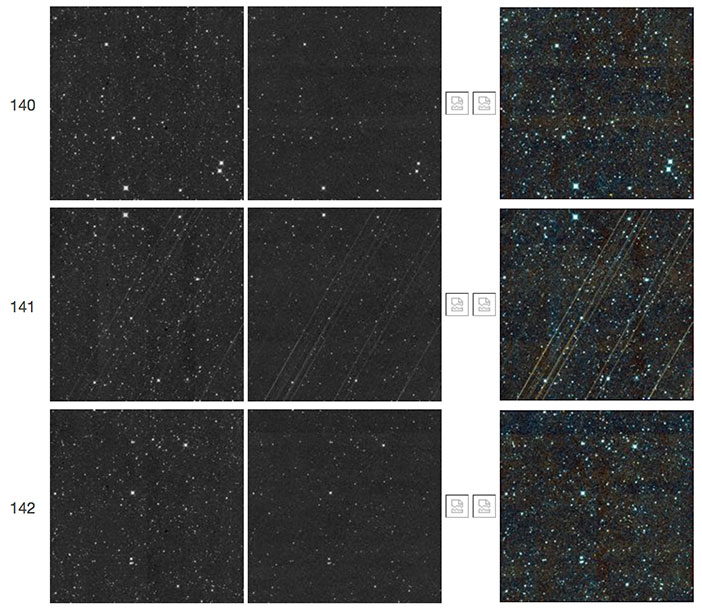 |
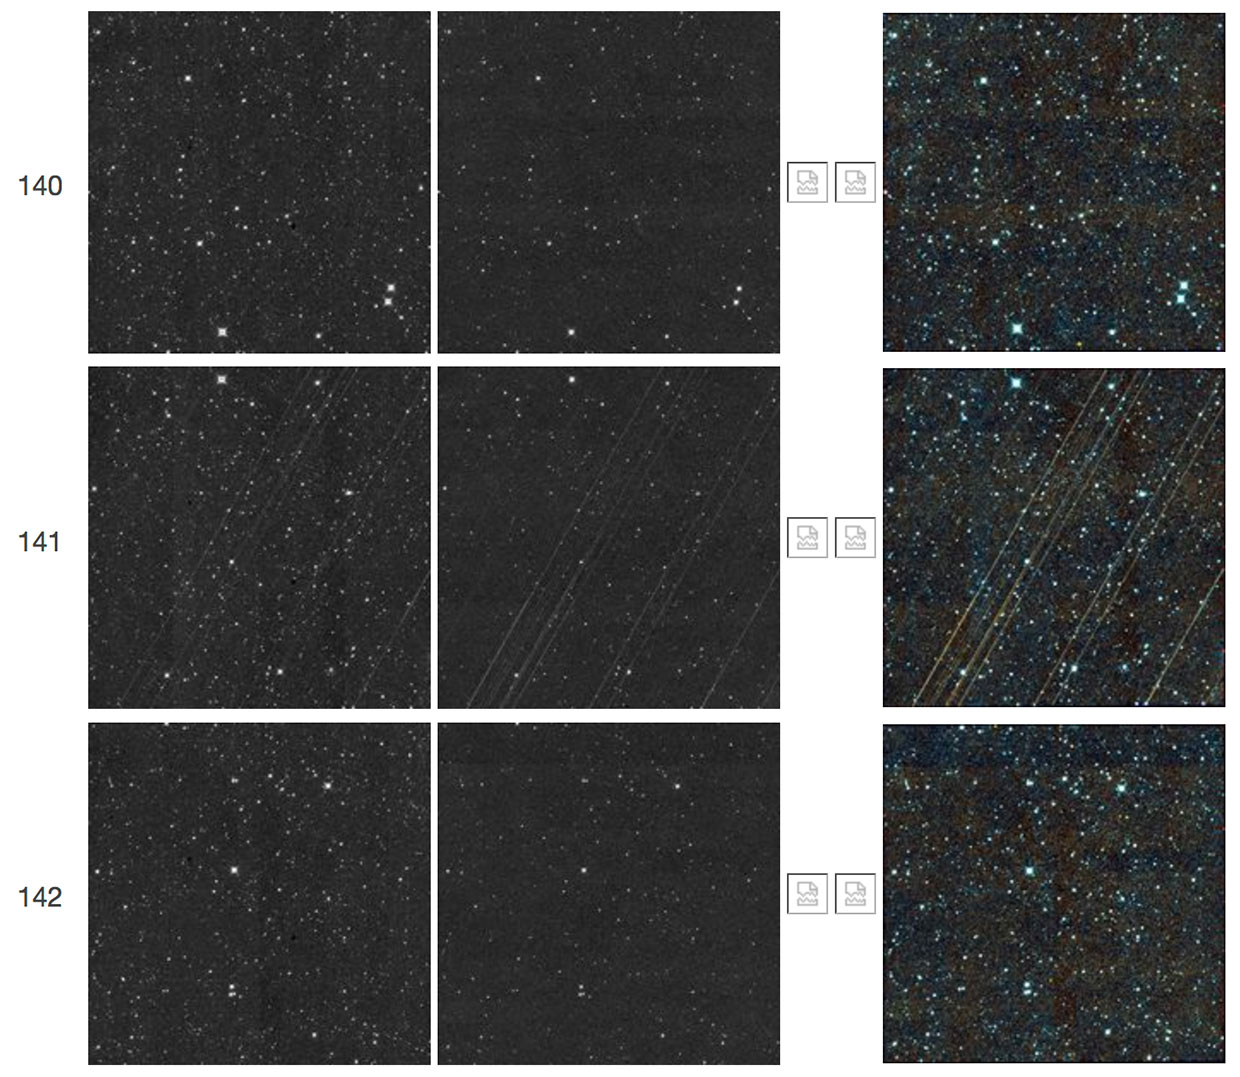
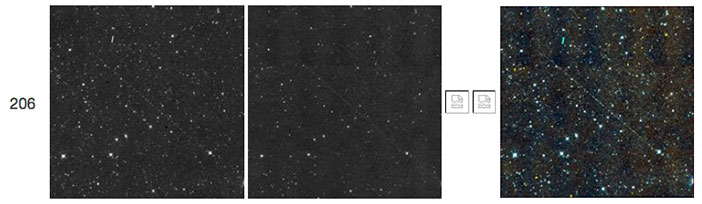
| Figure 57 - Single-exposure framesets
01807r140-142. Frameset 141 shows a series of W2-bright diagonal streaks
that are not seen in either the preceding or following framesets. The
streaks were caused by orbital debris above NEOWISE. This NEOWISE image
was taken on 2019 Jan 05 UT, and the debris is from ORBCOMM's first
generation (OG1) satellite that broke up just a few days before, on 2018
Dec 22 UT. At least twenty streaks can be discerned at higher contrast
in W2. |
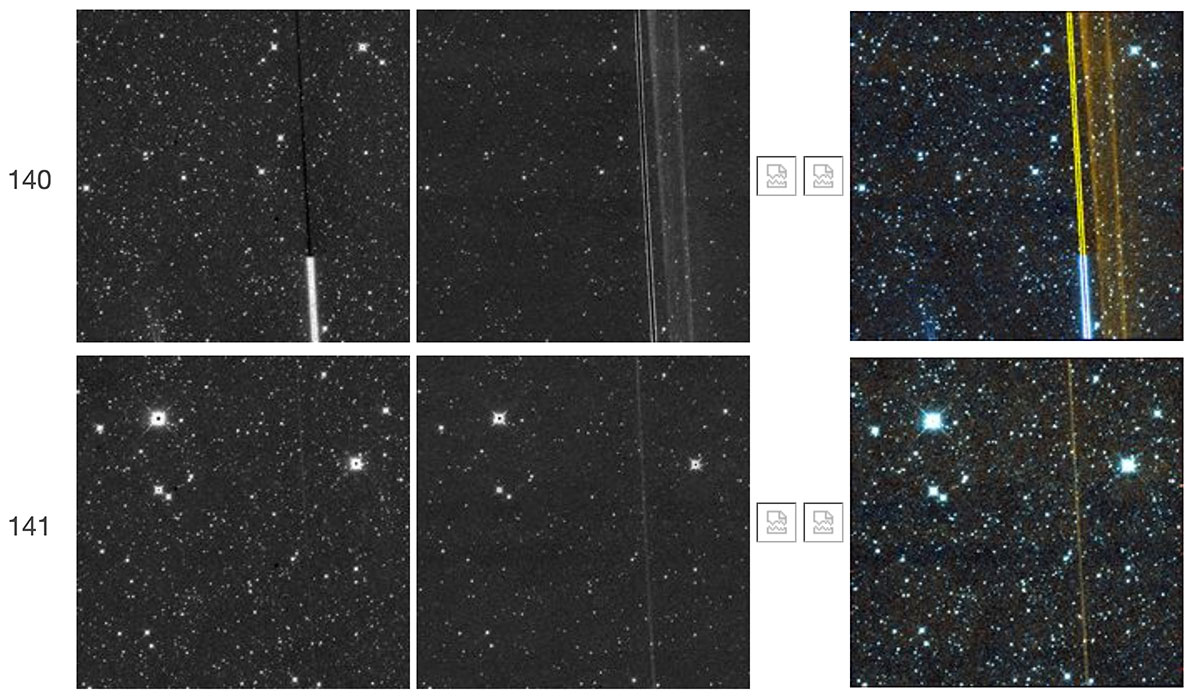
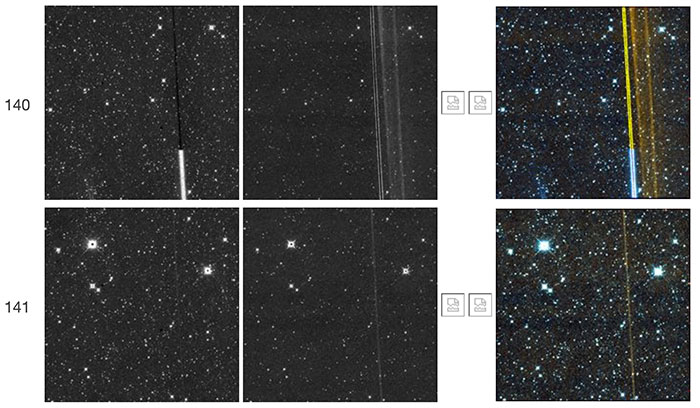 |
| Figure 58 - Single-exposure framesets
21850r140-141. Frameset 140 shows a satellite trail of unusual
appearance. It was partially read in W1, and it and its ghost
were fully read in W2, showing that the trail was saturated at its
core. The ghost, at the right-hand side in 140,
curiously shows that its inner edge is not exactly parallel to the
outer edge or to the trail. |
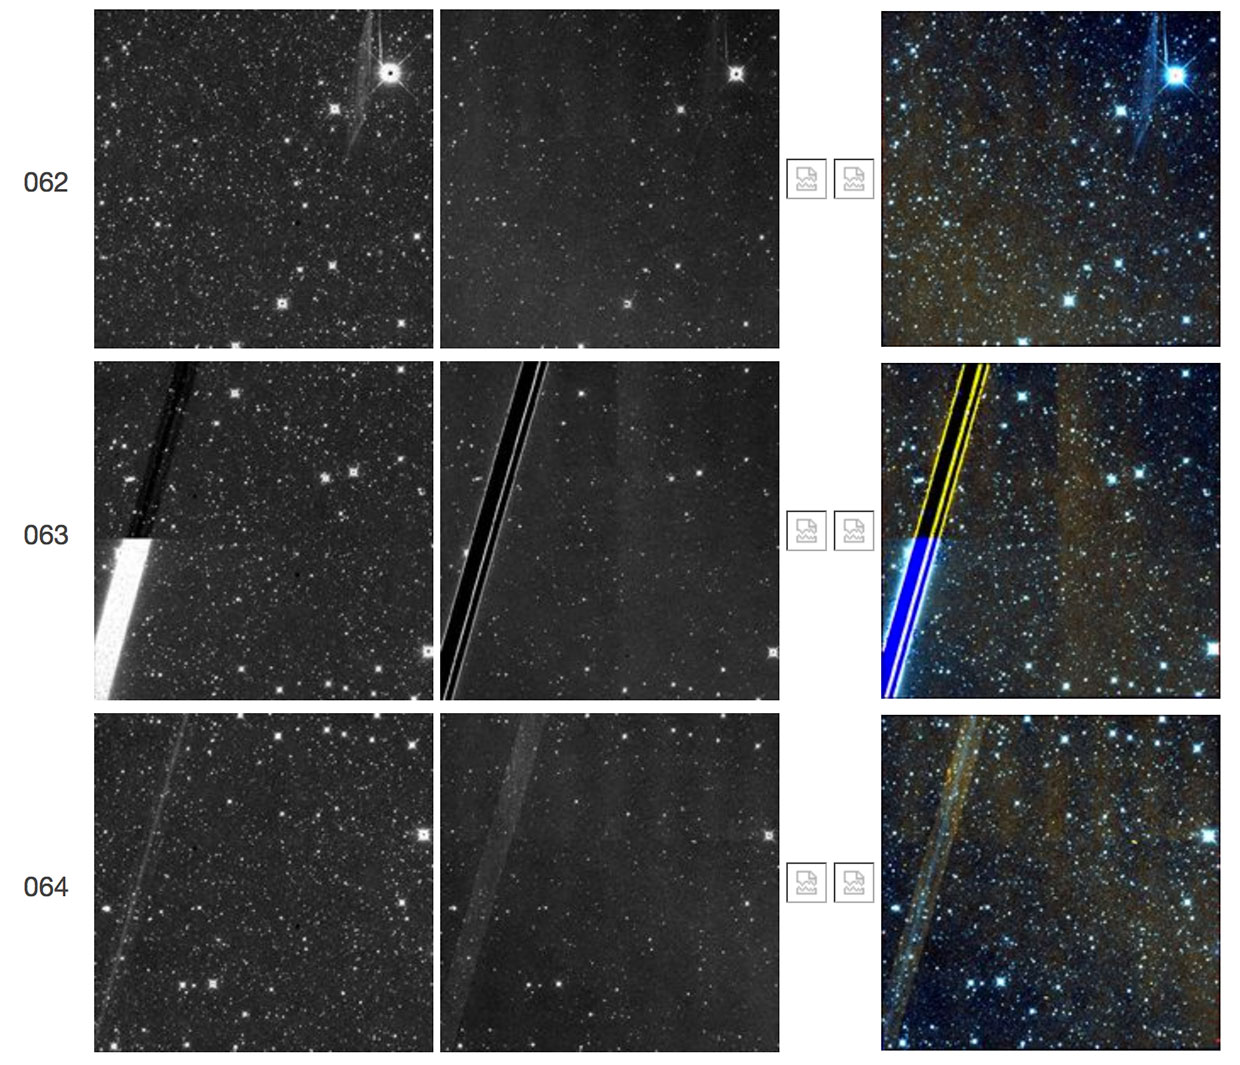
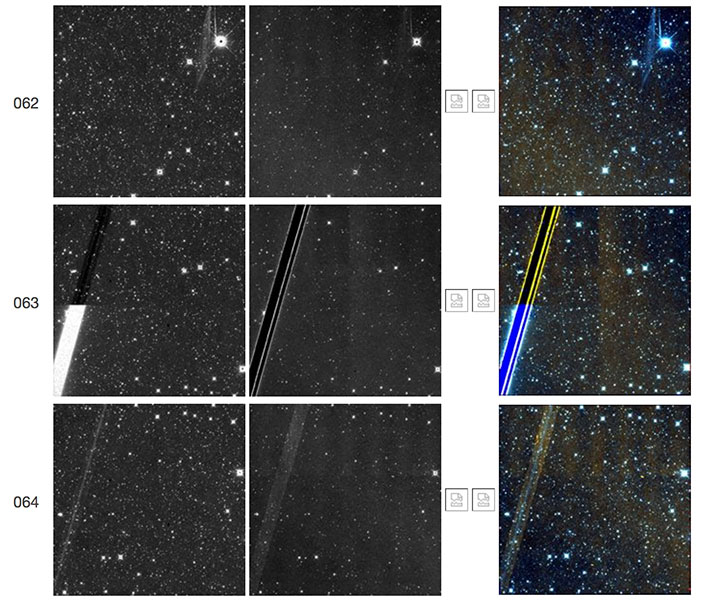 |
| Figure 58a - Single-exposure framesets
30404r062-064. Frameset 063 shows a set of satellite trails of unusual
appearance, which were partially read in W1 and fully read in W2.
Figure 58b shows the W1 frame of 063 at a different image scale
and exhibits three thick satellite trails. The three satellite
trails are core-saturated in W2 and their level-1b pixels are
consequently NaN, indicated by the dark swaths in the W2 image.
The bright thin lines in the W2 image of 063 are the edges of the
satellite trails, where the leftmost and middle lines enclose both
the leftmost and middle satellite trails, while the middle and
rightmost lines enclose the rightmost satellite trail. The region
between the leftmost and middle satellite trails must be saturated
in W2 and is therefore not seen. The satellite trails left latents
in frameset 064 in both W1 and W2. The bright thin line in the W1
image of 064 is the peak signal of the middle trail and it is thus
distinct from the position of the bright lines in the W2 image of 063.
|
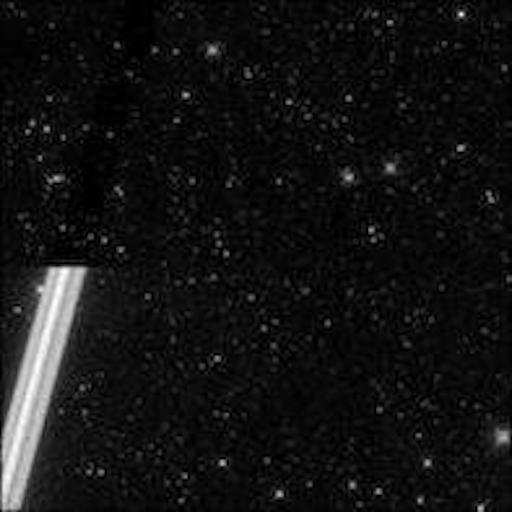 |
| Figure 58b - Single-exposure frameset
30404r063. This is another version of the W1 frame of the satellite trails
shown in the middle row in Figure 58a, but at a different image
stretch to enhance detail. |
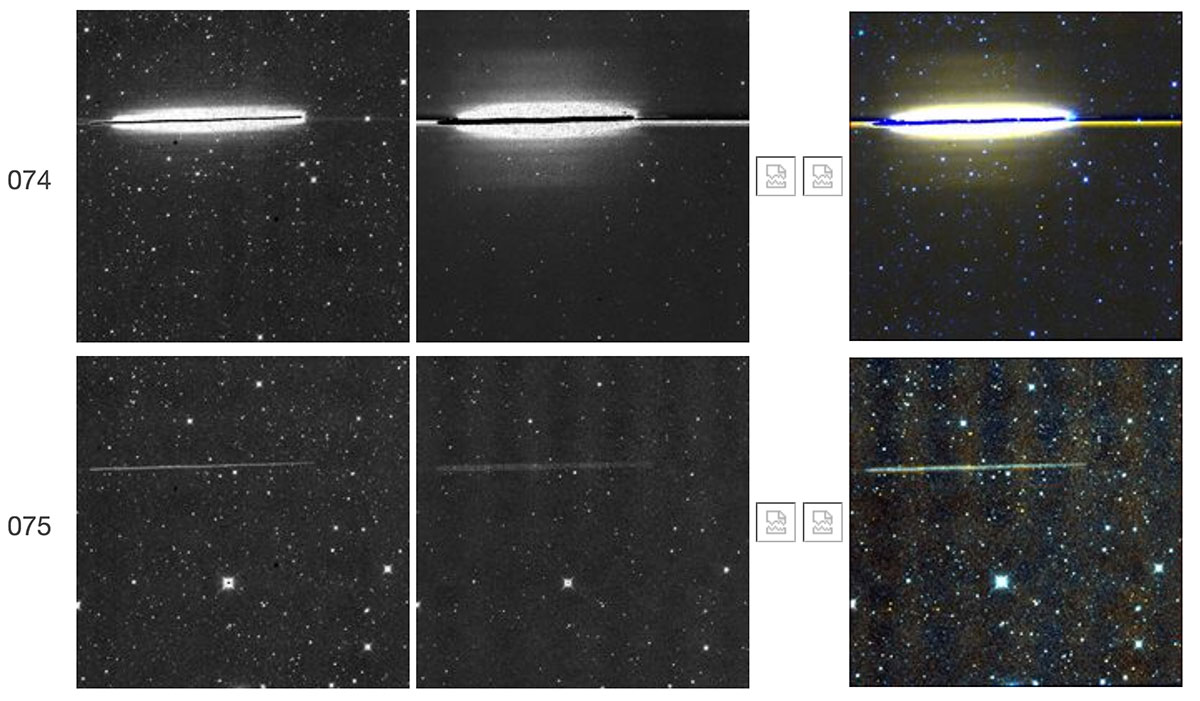
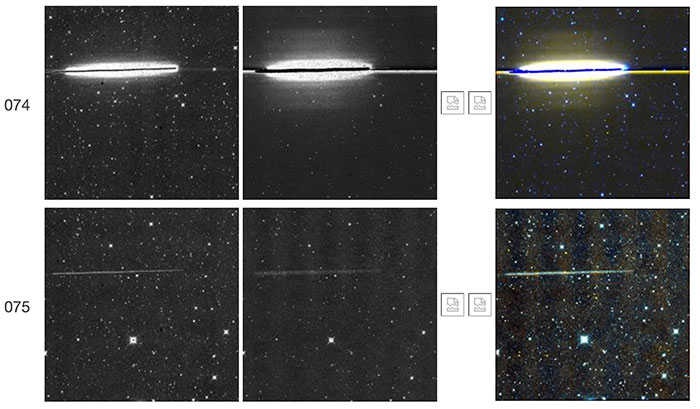 |
| Figure 59 - Single-exposure framesets
22250r074-075. The short but dramatic satellite trail in frameset
074 is saturated at its core, and leaves a latent in frameset
075. The trail is not entirely horizontal, but frameset 074 shows a
horizontal linear feature running across the arrays. The linear
feature is of unknown nature in W1, but it is related to the
channel-bias correction applied by the pipeline in W2, as described
in Figure 59a, below. |
 |
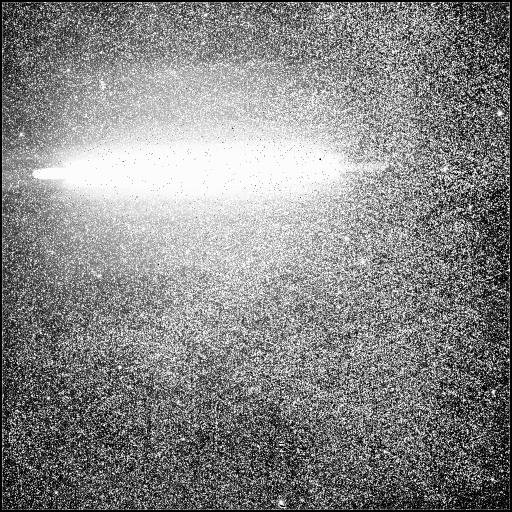
 |
| Figure 59a (Left panel)- Single-exposure frameset
22250r074, as in Figure 59, above. This is the raw (level-0) W2
frame. Figure 59b (Right panel) This is the
pipeline-processed (level-1b) W2 frame. The image scale of both
figures has been heavily stretched. The raw data in Figure 59a shows
the satellite
trail but not the horizontal line described in Figure 59. The
pipeline-processed data in Figure 59b shows the horizontal line and
bright and dark linear features along it. There is an issue with the
channel-bias correction in the pipeline. Flux from the almost-horizontal
satellite trail impacts the correction for the W2 read-out channel
(running horizontally in W2) containing most of the flux.
|
Astrometric effects:
Rare anomalies in the astrometric reconstruction may be uncovered by
visual inspection of images in either individual bands (W1 or W2) or in
combination in color-composite mosaics.
Astrometric effects: Band-to-band differences in rotation angle
An unusual feature may be seen in the color-composite mosaics when
the center of the framesets are very near the equatorial poles. The
feature consists of an apparent rotational difference between the two
bands, leading to a misregistration of detected sources. It is possible
the lack of precision from small-angle approximation leads to small but
discernible differences in the rotation matrices of the W1 and W2
frames.
 |
| Figure 60 - Single-exposure frameset 37562r244. The
W1 and W2 images exhibit a small relative rotation centered at the
equatorial pole contained in the frameset. In this case, the center of
frames is within 0.009 degrees of the south equatorial pole. The
computed rotation angle WCROTA2 for each band differs from the other
band by approximately 4 degrees, unlike a typical difference of 0.2
degrees or less for other framesets. It is possible a small-angle
precision problem leads to this effect. There have been other instances
of this effect in NEOWISE Reactivation and earlier data releases, but of
much smaller magnitude. |
Last update: 1 February 2024