


Photometric calibration of AllWISE source photometry followed the same basic procedure that was used to calibrate photometry for the WISE All-Sky Data Release, as described in section IV.4.h of the WISE All-Sky Release Explanatory Supplement. Source fluxes measured in instrumental units (DN) are converted to calibrated magnitudes by application of band-dependent instrumental zero point offsets that are derived from measurements of a network of calibration stars.
As with previous WISE data releases, the magnitudes reported in the AllWISE Source Catalog, Reject Table and Multiepoch Photometry Database are in the Vega system, and represent total in-band brightness. Conversion of AllWISE magnitudes to flux-densities, AB magnitudes, and possible color corrections are described in section IV.4.h.i of the WISE All-Sky Release Explanatory Supplement.
The primary update to the photometric calibration for AllWISE was to refine the instrumental zero points to better track the changes in the detector system response over time.
ALLWISE combined data taken during three distinct survey phases. The photometric zero points during the 4-Band Cryo phase were extremely stable so constant values were used for each band. For the 3-band Cryo and Post-Cryo phases, the zero points changed significantly over time because of the steady increase in the payload temperature. WISE calibration star measurements were examined over the entire mission to derive the adjustments to the time-dependent zero points for AllWISE.
The differences between the predicted W1 and W2 magnitudes of all calibration stars and those measured on the Single-exposures are plotted as a function of time over the full survey in Figure 1. Survey phase boundaries are marked with vertical lines. The red lines in Figure 1 represent moving trimmed averages of the photometric residuals computed over each survey phase independently. The beginning and ending scans in each phase are anchored by extrapolation using the neighboring trimmed average.
Updates to the W1 and W2 photometric zero points were derived from the trimmed average residuals shown in Figure 1. The W1 photometry in the 4-Band Cryo period was consistently 0.011 mag too bright relative to the predicted standard star magnitudes, so the constant W1 zero point was adjusted upward for that period. Time-dependent W1 and W2 zero point adjustments were computed from the moving average fits using a local polynomial regression on the discrete moving averages shown in Figure 1, as described in V.3.a.iii.1.
The time-dependent zero point adjustments, dZP(MJD), were applied to the instrumental zero points of each Single-exposure image set during the throughput matching step of image coaddition module, as follows:
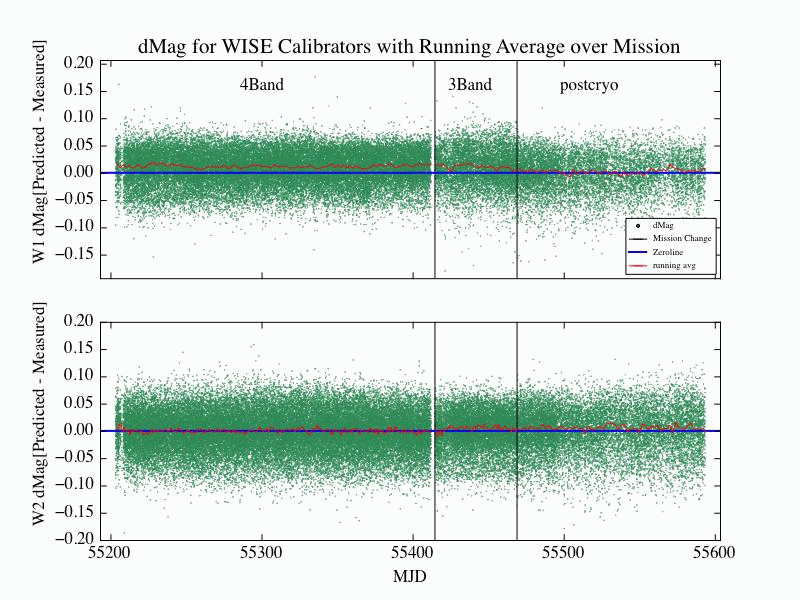 |
| Figure 1 - The differences between the predicted W1 (top) and W2 (bottom) magnitudes of WISE calibration stars and their measured calibrated magnitudes on the Single-exposures, plotted as a function of time throughout the full WISE mission. Vertical lines demarcate the different survey phases. The red lines are moving trimmed average fits made to the residuals in each survey phase separately. |
Last update: 21 November 2013