


For the Post-Cryo data, we re-assessed thresholds for the per-frame image quality metrics as described below.
Although the threshold on image axial ratio (rbovera) was left unchanged, as was the lower threshold for NoisePix, the previous upper threshold of NoisePix = 14.5 was increased to NoisePix = 15.0 during Post-Cryo processing. The number of framesets affected by this change is illustrated in Figure 1, which plots the W1 axial ratio (rbovera) values against W1 NoisePix. We discuss the reasons for this change below.
ScanFrame data processed as of June 30, 2012, as part of Post-Cryo pipeline tests enabled us to judge the extent to which relaxing the NoisePix threshold would degrade photometry. The tests included many scans of the same area of sky, allowing us to see how changes in image quality would affect the resulting photometry. Using data from these tests, we identified pairs of framesets whose on-sky frame centers fell with 5 arcminutes of each other. For such pairs, individual source extractions in each frameset were spatially associated using a 0.3-arcsecond match radius. We then identified three classes of frameset pairs and analyzed each to judge the how an increase in NoisePix values would affect photometry:
"Passing vs. passing" frameset pairs: One frameset in the pair has 12.0 < NoisePix < 12.5 and the other has 13.0 < NoisePix < 13.5. Both framesets would easily pass previous image metrics. The test data have 477 such frameset pairs, containing 401,900 matched sources.
"Passing vs. mildly failing" frameset pairs: One frameset in the pair has NoisePix < 13.5, indicating no problem with image quality. The other has 14.5 < NoisePix < 15.0 and would thus "mildly" fail QA image metrics because the value of NoisePix is higher than the previously existing threshold of 14.5. There are 521 such frameset pairs, containing 358,337 matched sources.
"Passing vs. gravely failing" frameset pairs: One frameset in the pair has NoisePix < 13.5, indicating no problem with image quality. The other frameset has a value of 18.0 < NoisePix < 19.0 and would "gravely" fail image metrics. There are 88 such frameset pairs, containing 24,275 matched sources.
For each of the classes above, we computed the difference in W1 profile-fit photometry (w1mpro) for each matched source. The sense of this difference is the w1mpro measurement from the frameset with higher NoisePix minus the w1mpro measurement from the frameset with lower NoisePix. The following figures plot this difference as a function of w1mpro for each of the three cases above -- "passing vs. passing" (Figure 2), "passing vs. mildly failing" (Figure 3), and "passing vs. gravely failing" (Figure 4). The red solid circles connected with red lines are the median values of the difference in w1mpro computed in w1mpro bins of 1-mag width.
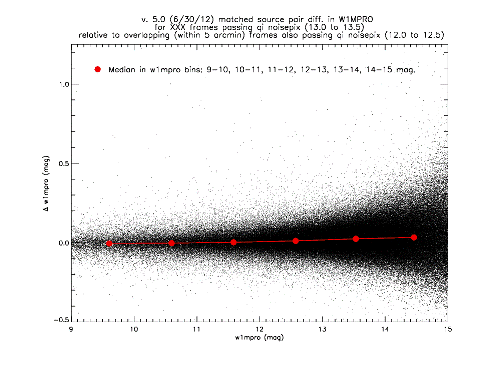 |
| Figure 2 - The difference in W1 profile-fit magnitudes plotted as a function of the W1 profile-fit magnitude for frameset pairs in the "passing vs. passing" class. |
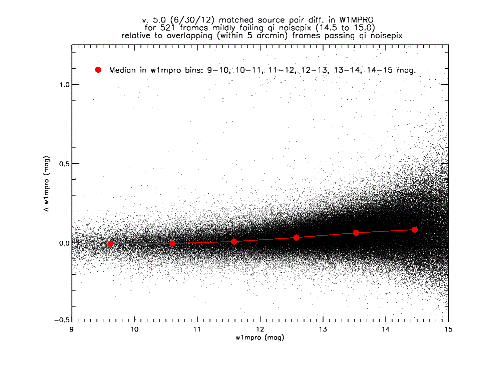 |
| Figure 3 - The difference in W1 profile-fit magnitudes plotted as a function of the W1 profile-fit magnitude for frameset pairs in the "passing vs. mildly failing" class. |
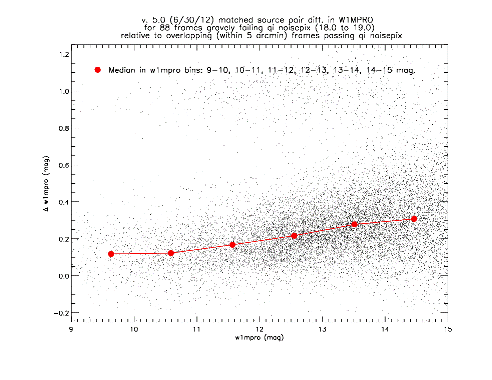 |
| Figure 4 - The difference in W1 profile-fit magnitudes plotted as a function of the W1 profile-fit magnitude for frameset pairs in the "passing vs. gravely failing" class. |
These figures show that the median difference in w1mpro at the faintest magnitudes is approximately 0.02 mag for "passing vs. passing" (Figure 2), 0.10 mag for "passing vs. mildly failing" (Figure 3), and 0.32 mag for "passing vs. gravely failing" (Figure 4). Interestingly, the median difference in w1mpro is significantly above 0.0 even for the brightest sources plotted in Figure 4. We also note that the median difference in w1mpro does not monotonically increase for the faintest sources in Figures 3 and 4, but instead levels off, most likely because the number of detected source pairs drops off at W1 ~ 15 mag.
We further examined the above effects by plotting the median of the w1mpro differences in w1mpro bins of 1-mag width as a function of w1mpro for the "passing vs. passing" (Figure 5), "passing vs. mildly failing" (Figure 6), and "passing vs. gravely failing" (Figure 7) classes. Each magnitude bin in these figures appears as a distinct cloud of points whose discreet appearance is not physical, but rather a result of our choice of magnitude bins delimited at whole magnitudes (9.0, 10.0, 11.0, etc.). The prevailing w1mpro value for each of these clouds is larger (fainter) than the mid-point of the magnitude bin, due to an increasing number of sources with increasing magnitude within each bin.
Figure 5 shows that the median w1mpro difference has a prevailing value of 0.025 mag at the faintest magnitudes and 0.0 mag at the brightest ones, consistent with Figure 2.
Similarly, Figure 6 shows that the median w1mpro difference has a prevailing value of 0.1 mag at the faintest magnitudes, consistent with Figure 3. These median differences span a range of about 0.2 magnitudes for each bin. At the brightest magnitudes, such median differences are nearly 0.0 mag.
Figure 7 shows that the median w1mpro difference has a prevailing value of 0.3 mag at the faintest magnitudes, consistent with Figure 4. Figure 7 also shows that the median difference is prevailingly 0.08 mag at the brightest magnitudes. The delta magnitudes span a range of about 0.3 mag for each of the w1mpro magnitude bins shown in Figure 7.
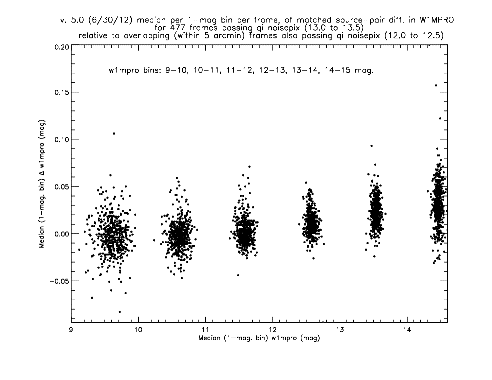 |
| Figure 5 - The median of the w1mpro differences in w1mpro bins of 1-mag width as a function of w1mpro for the "passing vs. passing" class. |
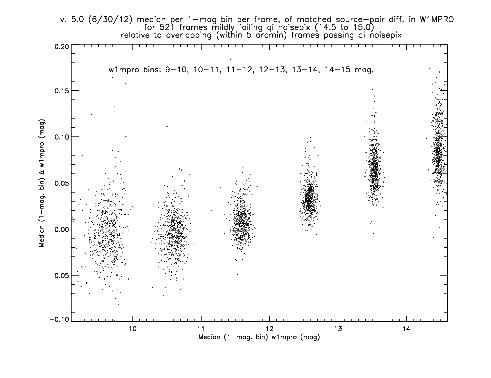 |
| Figure 6 - The median of the w1mpro differences in w1mpro bins of 1-mag width as a function of w1mpro for the "passing vs. mildly failing" class. |
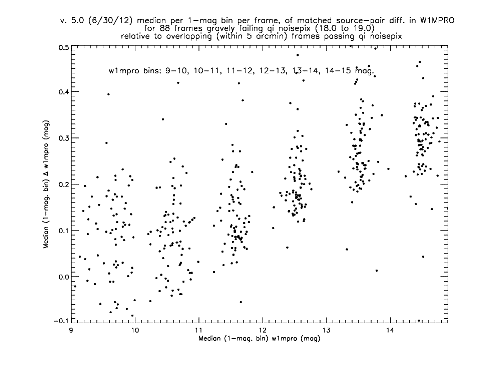 |
| Figure 7 - The median of the w1mpro differences in w1mpro bins of 1-mag width as a function of w1mpro for the "passing vs. gravely failing" class. |
Models of the spectral energy distribution of asteroids are not better than 0.1 mag at the faintest levels illustrated in Figures 2 through 7, meaning that this level of photometric accuracy is tolerable for the NEOWISE science case. The prevailing difference of 0.1 mag seen at the faintest bins in Figures 3 and 6 means that framesets in the "mildly failing" category can now be allowed to pass, also leading to a gain in the number of passing framesets that can be used in downstream processing.
Therefore, the qi threshold was raised to NoisePix = 15.0 in Post-Cryo processing, and sources in Figures 3 and 6 that we previously regarded as "midly failing" qi will now be allowed to pass.


