VII. The WISE All-Sky Data Products
2. 3-Band Cryo Data Release
b. Image Atlas
Users of the image products are referred to the following images that
highlight examples of anomalies and features. This page shows only those oddities
specific to the 3-band Cryo data;
anomalies and features seen in all WISE data are covered elsewhere.
Note: There is a similar set of image anomalies and
features for single-exposure 3-band Cryo images in VII.2.d.i.
i. Image Anomalies
Each figure below shows two rows of images. From left to right in the top row
are shown the full Atlas images for W1, W2, W3, W4 (always blank for
these data, and represented by a broken icon), and a three-color image
comprised of W1(blue) + W2(green) + W3(red). From left to right in the bottom
row are the coverage maps for W1, W2, W3, and W4 (always blank,
represented by another broken icon), along
with another broken icon (where the color W2+W3+W4 image would be if there
were any W4 data). The greyscale
stretch in the coverage maps goes from black for a coverage of four or
fewer frames up to white for the maximum coverage in the image. This
maximum coverage value can vary depending on factors such as ecliptic
latitude, the quality scores of the input frames, and availability of
3-band Cryo data at that sky location.
Click on the thumbnails to see the images at higher resolution.
Readers are encouraged to use the WISE image service at IRSA to preview
these same images and to download the FITS files for further study. To
aid the reader, values of the coadd_ID are provided in the caption of
each image set below.
Image examples below are divided into the following categories:
Edge Effects:
Edges caused by partial sky coverage
Edges caused by W3 saturation
Edges caused by W3 moonlight-affected frames
Edges caused by image smearing
Low-coverage effects:
Multiple apparitions of slow-moving objects
Bleed-through of high-background areas
Bleed-through of cometary debris and satellite trails
Effects from Bright Objects:
The character of some bright object artifacts in the 3-band Cryo
data was different from that seen in the four-band All-Sky data
Bright latents
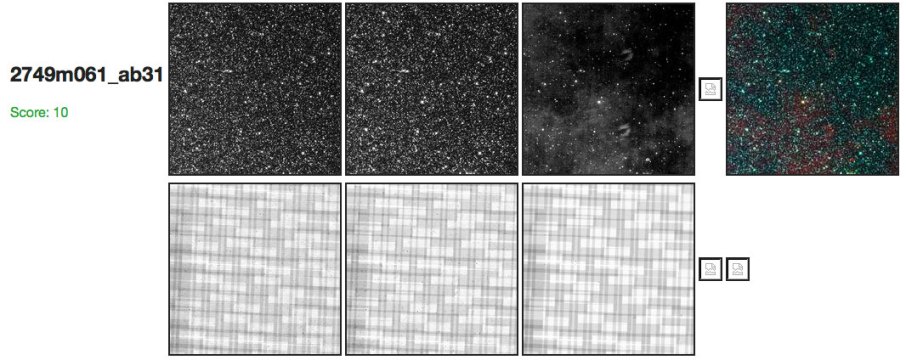 |
| Figure 1 - Atlas image 2749m061_ab31.
Bright latents from the Omega Nebula (M17), which is roughly ten
degrees from this region of sky, are seen as horseshoe-shaped artifacts
in the W3 image. See figure
6 in the frame image anomalies section for a single-frame example of the
saturation signature produced by the Omega Nebula. |
Dark latents
 |
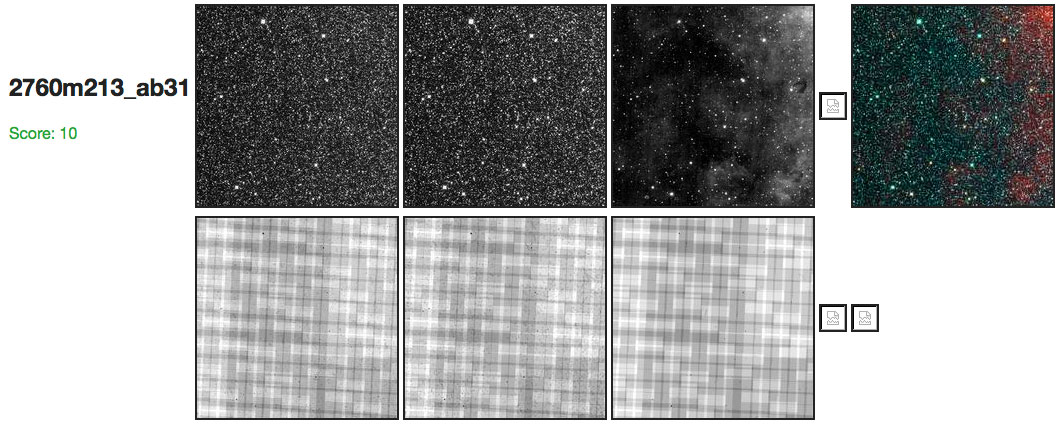
| Figure 2 - Atlas image 2760m213_ab31.
Dark latents from the Omega Nebula (M17) are seen as horseshoe-shaped artifacts
along the right edge of the W3 image. See figure
6 in the frame image anomalies section for a single-frame example of the
saturation signature produced by the Omega Nebula. |
Dark troughs
 |
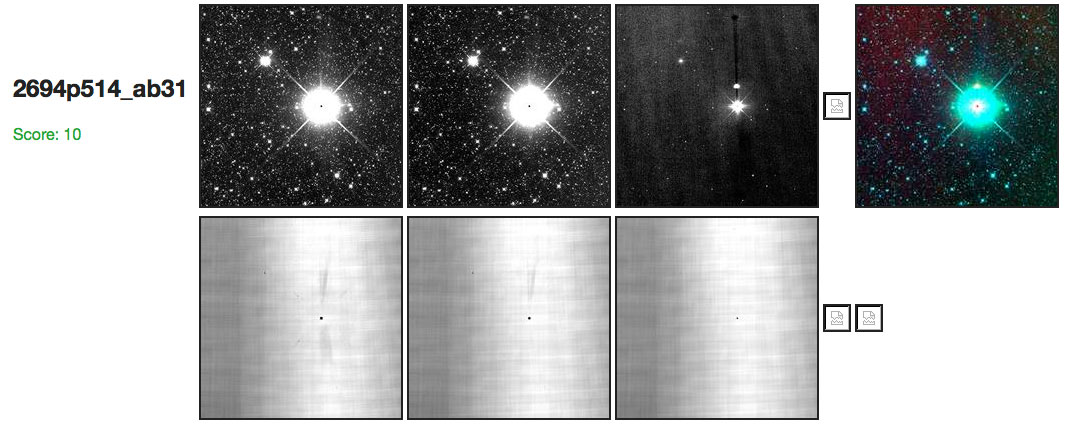
| Figure 3 - Atlas image 2694p514_ab31.
Bright stars in W3 may exhibit a dark trough aligned along frame
columns. In the example here, a W3 dark trough runs from the bright
star toward the top of the coadd. |
Saturation at W3:
Saturation in the W3 frames, particularly before the change-over
from the 8.8s exposure time to 4.4s exposure time, caused a couple of
different effects in the coadded data.
Imprints from saturation
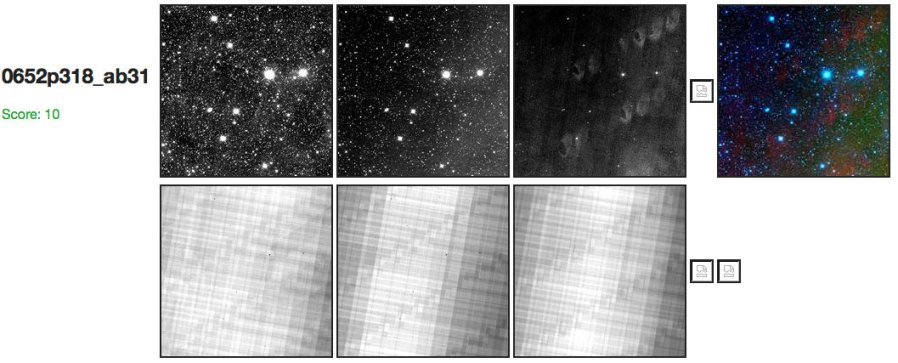 |
| Figure 4 - Atlas image 0652p318_ab31.
For single frames taken when the W3 array was near saturation,
severe scattered moonlight artifacts would sometimes cause saturation. In this coadd, a series of
saturated artifacts are imprinted as two partial, parallel rows of ovals
marching diagnonally across the field. |
No W3 coverage
 |
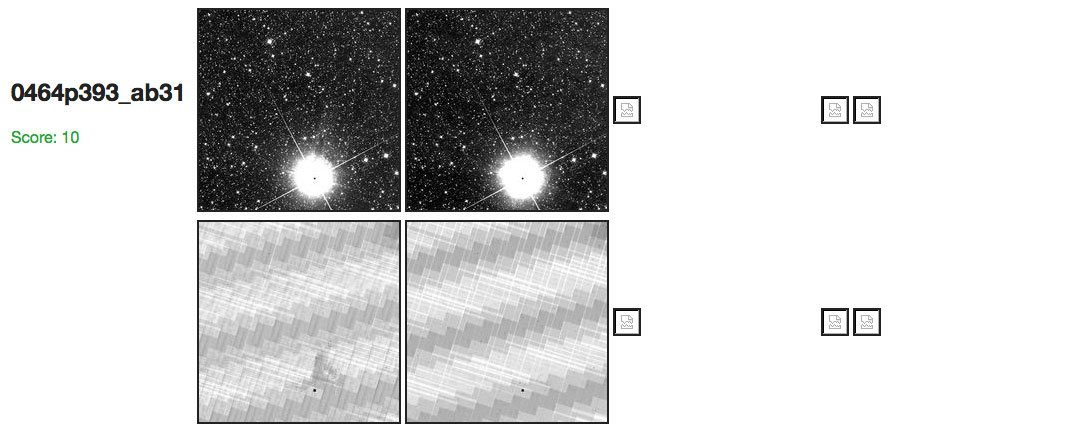
| Figure 5 - Atlas image 0464p393_ab31.
Some sky locations covered in the 3-band cryo period, such as this
one, do not have any valid W3 data. These
areas were observed near the end of the 8.8s exposure period when the W3 array was
largely saturated. Such saturated
W3 frames were omitted from coadd processing. |
High W3 Backgrounds:
The higher backgrounds in the W3 frames frequently imprinted odd
patterns into the coadded data
Moon glow
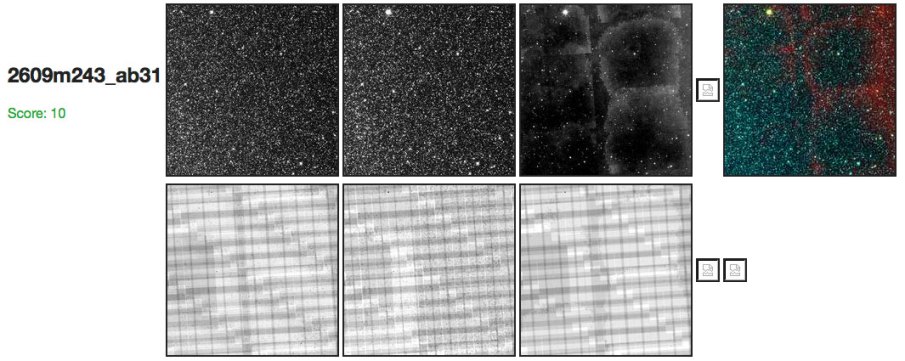 |
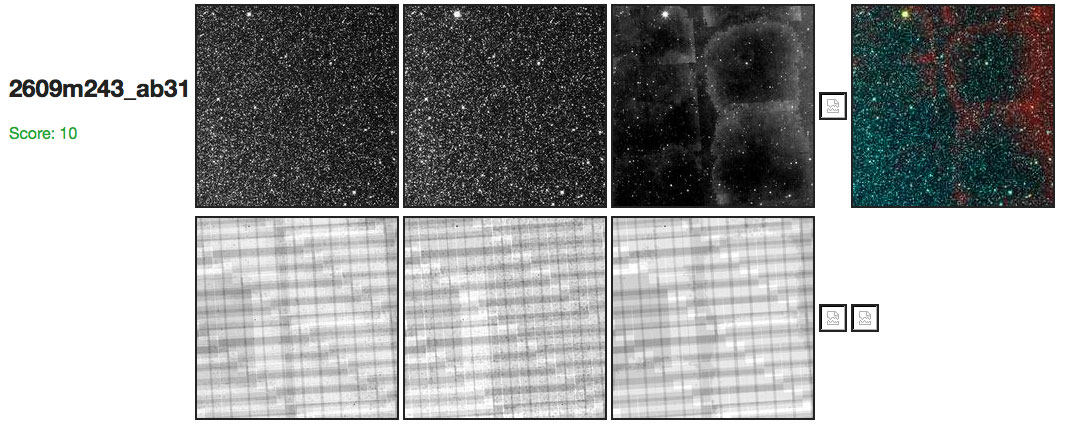
| Figure 6 - Atlas image 2609m243_ab31.
Scattered moonlight in the W3 frames can create unusual patterns in
the coadds. Here, several heavily
moon-affected frames have left a honeycomb-like imprint in the W3 coadd. |
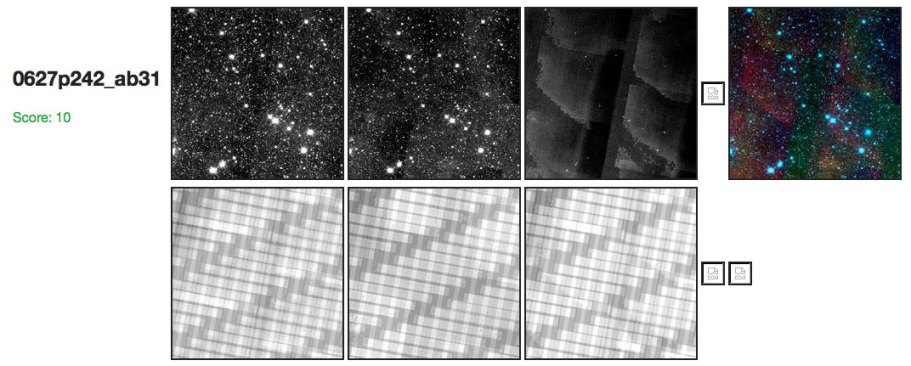 |
| Figure 7 - Atlas image 0627p242_ab31.
Scattered moonlight in the W3 frames can create unusual patterns in
the coadds. Here, several heavily
moon-affected frames have left block-like imprints in the W3 coadd. |
Moon diffraction spikes
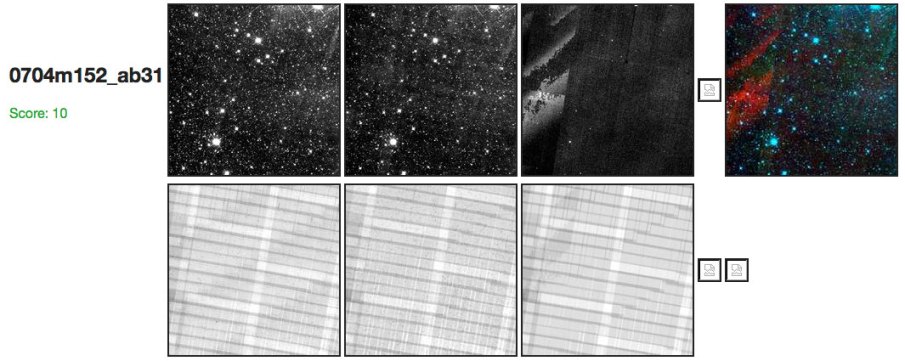 |
| Figure 8 - Atlas image 0704m152_ab31. Similar effects to those seen in Figures 6 and 7 above can be caused by the Moon's diffraction spikes. Here, frames impacted by diffraction spikes angled in different directions imprint into the upper left of the W3 coadd as a chevron-shaped artifact. |
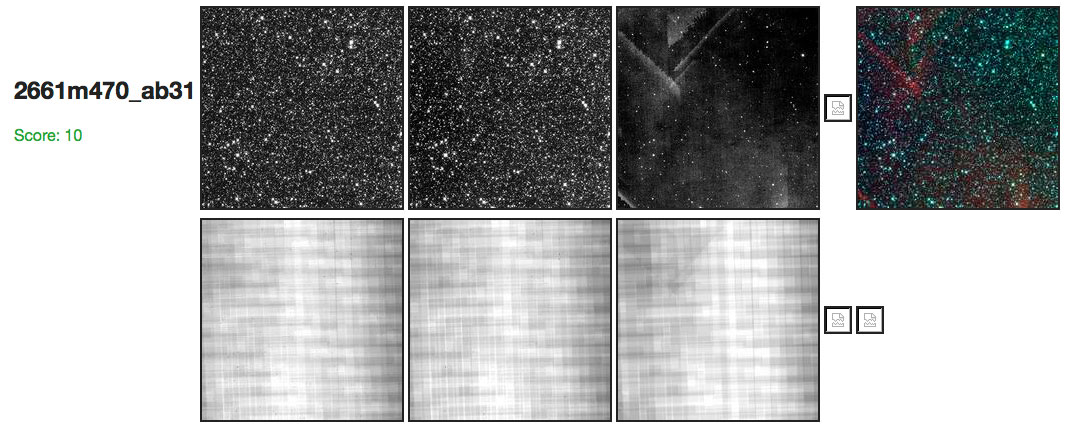
|
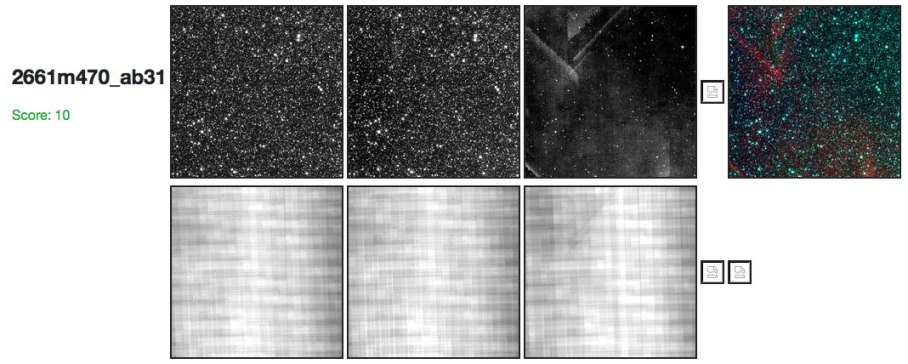
| Figure 9 - Atlas image 2661m470_ab31. Similar effects to those seen in Figures 6 and 7 above can be caused
by the Moon's diffraction spikes. Here, frames impacted by these
diffraction spikes have left their imprint on the left side of the W3 coadd. |
Single high-background frames
 |
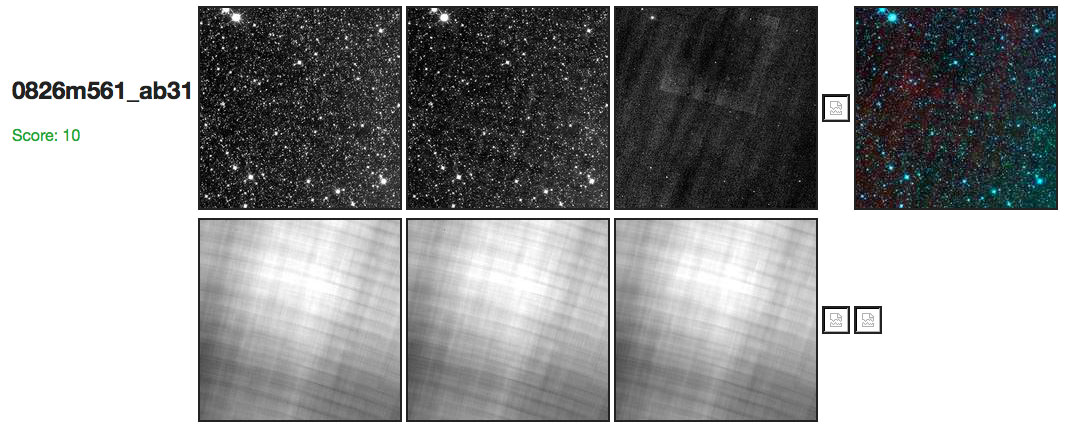
| Figure 10 - Atlas image 0826m561_ab31.
A single frame with a high background makes a large, square imprint in the upper
half of the W3 coadd. The striping in W3 is at levels below 0.1% and its origin is unknown. |
Edge Effects:
Unlike the four-band All-Sky data, the 3-band cryo data do not
cover the entire sky and hence many coadd tiles contain areas
lacking data; saturated W3 frames caused other holes in coverage,
as well
Edges caused by partial sky coverage
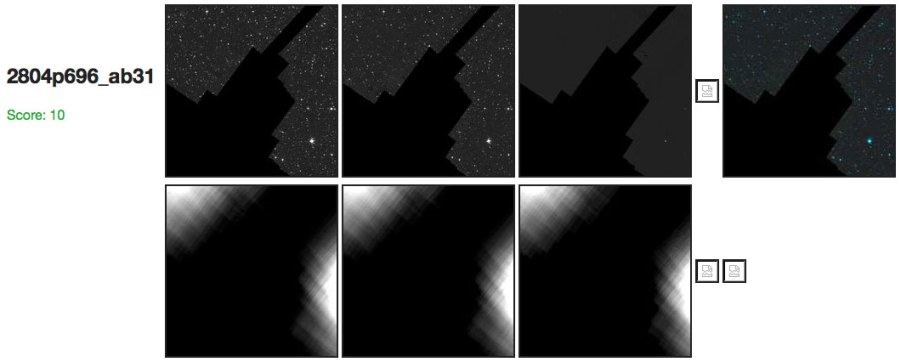 |
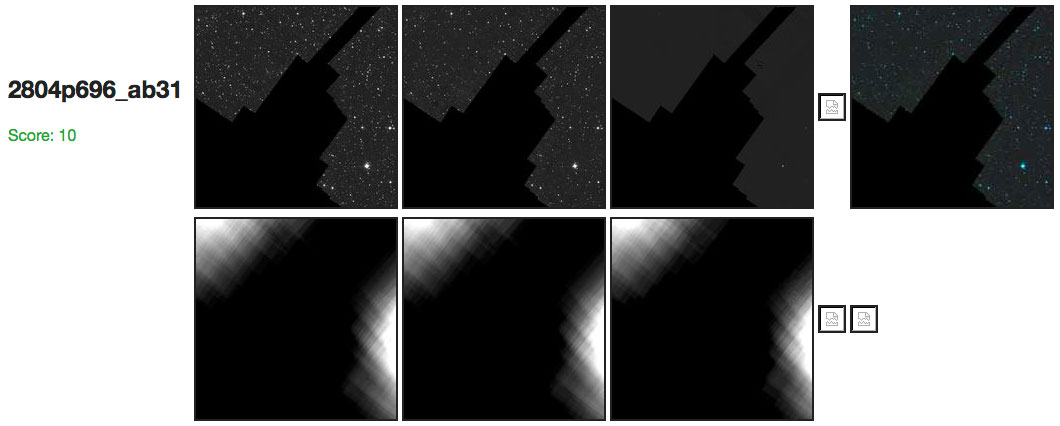
| Figure 11 - Atlas image 2804p696_ab31.
Because the 3-band cryo data cover only a fraction of the sky, many
coadds have areas of zero coverage. In this coadd, located near the
north ecliptic pole, a wedge of uncovered sky extends from lower
left to upper right. |
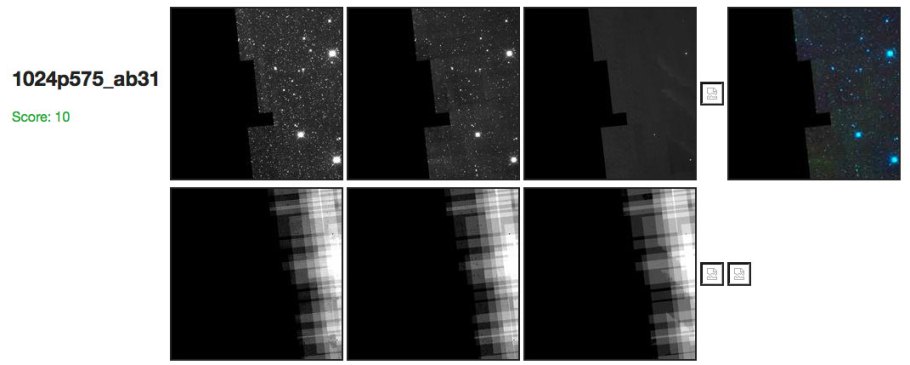 |
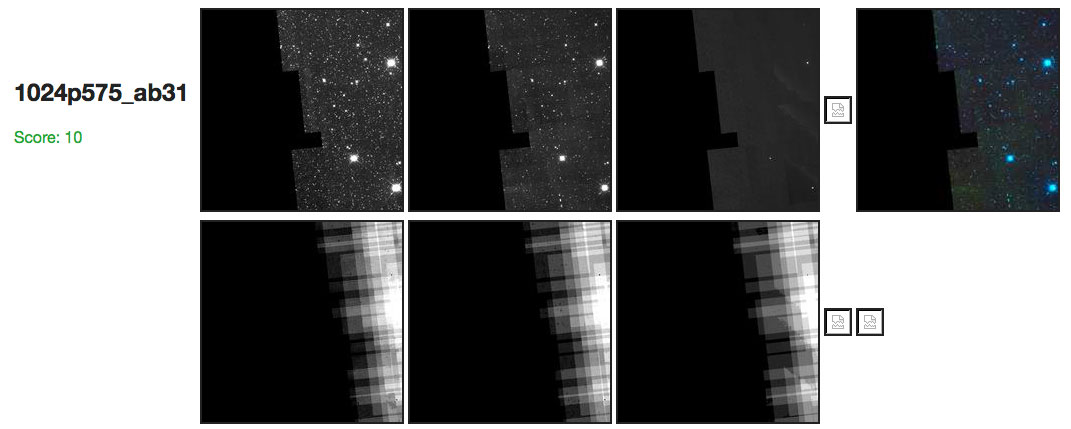
| Figure 12 - Atlas image 1024p575_ab31.
Because the 3-band cryo data cover only a fraction of the sky, many
coadds have areas of zero coverage. In this coadd, there is no
coverage over most of the left half of the field. |
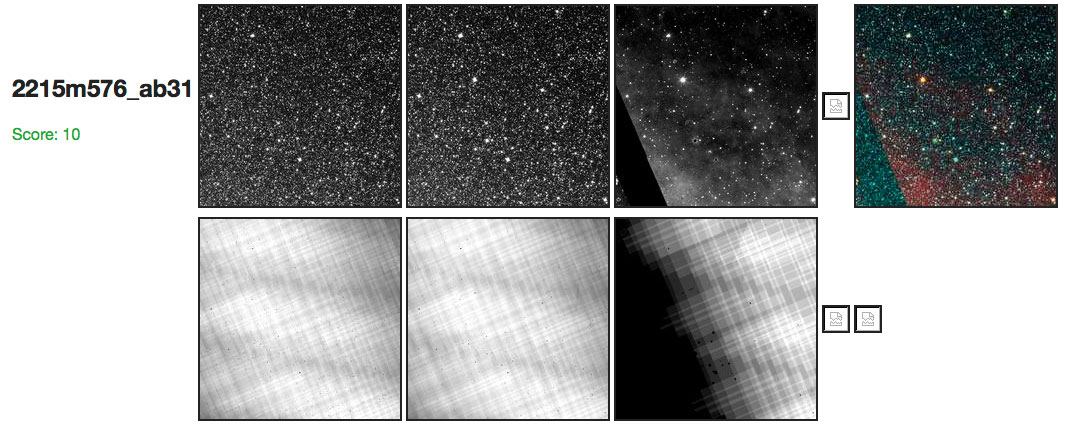
Edges caused by W3 saturation
 |
| Figure 13 - Atlas image 2215m576_ab31.
Some coadds have edges only in W3 because saturated data were removed
from coadd processing. In this coadd, the removal of saturated W3
data leads to an area of missing coverage in the lower left corner of
the W3 coadd. |
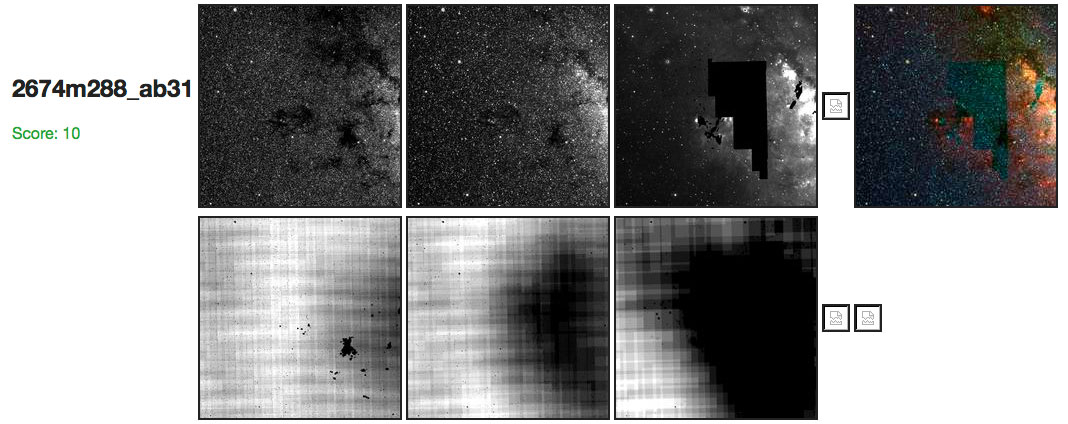
Edges caused by moonlight-affected frames
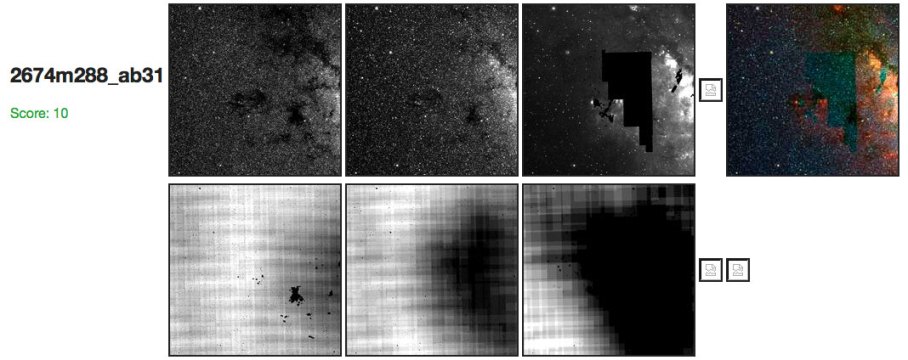 |
| Figure 14 - Atlas image 2674m288_ab31.
Some coadds have edges only in W3 because frames with heavy moonlight
contamination were removed
from coadd processing. In this coadd, the removal of moon-contaminated W3
data leads to an area of missing coverage in the center of
the W3 coadd, which is located very close to the Galactic Center. |
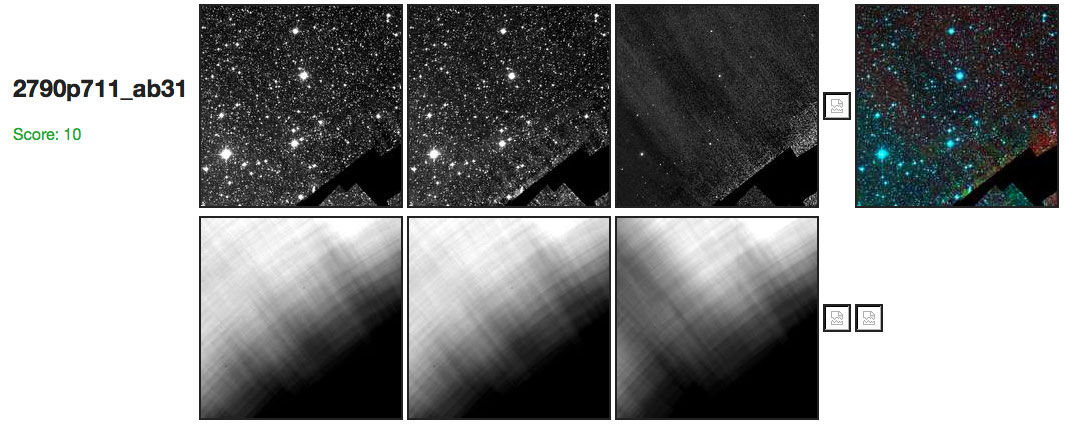
Edges caused by image smearing
 |
| Figure 15 - Atlas image 2790p711_ab31.
Some coadds have missing data for reasons other than lack of sky
coverage, inadvertent W3 saturation, or severe scattered moonlight. In the example shown here,
image smearing near the same point in consecutive scans leaves some
areas with no
high-quality data. This coadd, which is missing data at lower right,
is just six degrees from the north ecliptic pole, and the smearing
was likely caused by settling from small spacecraft maneuvers
between scans. |
Low-coverage Effects:
Areas near the edges in coverage typically have lower than average
coverage, which means that outlier rejection in the coaddition
process is less efficient at removing spurious features
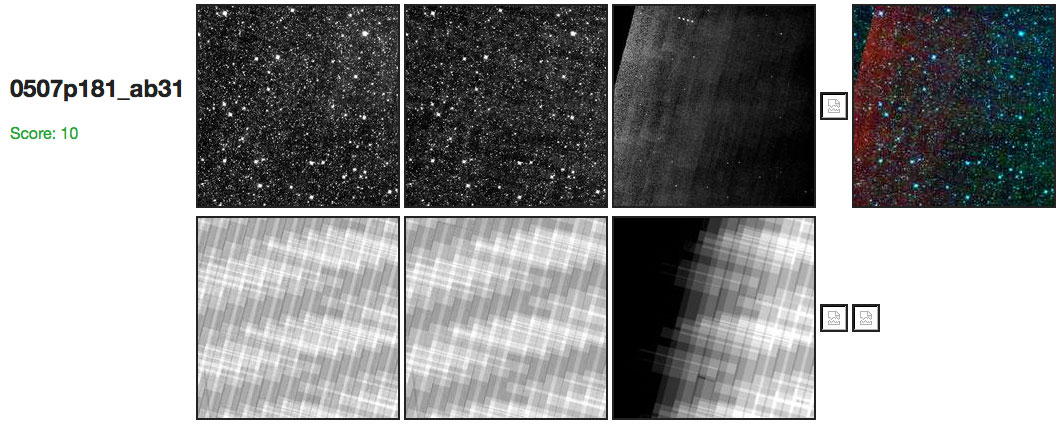
Multiple apparitions of slow-moving
objects
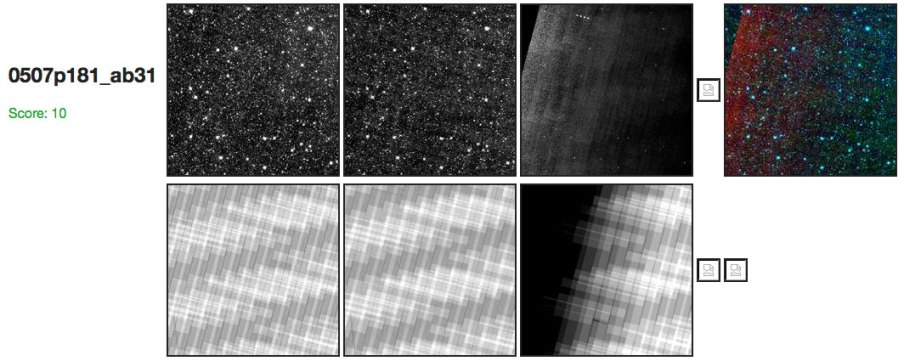 |
| Figure 16 - Atlas image 0507p181_ab31.
Coadds with areas of low coverage may have unusual features; when the
number of frames at a given spot falls below five, outlier rejection
in the coaddition process is not able to remove single-frame
events. In this example, the line of four bright points near the top
edge of the W3 array are four separate apparitions of asteroid
846 Lipperta seen in consecutive scans. |
Bleed-through of high-background areas
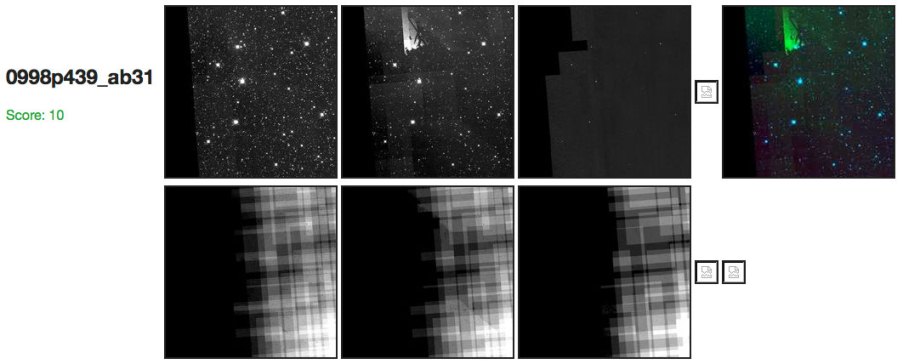 |
| Figure 17 - Atlas image 0998p439_ab31.
Coadds with areas of low coverage may have unusual features; when the
number of frames at a given spot falls below five, outlier rejection
in the coaddition process is not able to remove single-frame
events. In this example, a single W2 frame with a moon diffraction
spike imprints itself into the coadd. |
Bleed-through of cometary debris and satellite trails
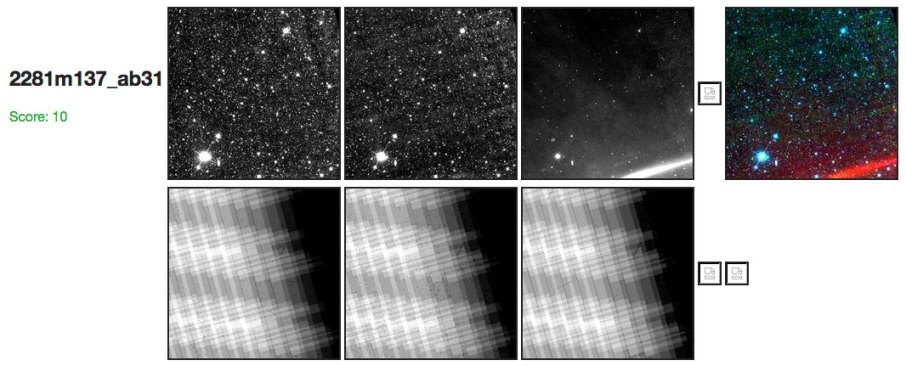 |
| Figure 18 - Atlas image 2281m137_ab31.
Coadds with areas of low coverage may have unusual features; when the
number of frames at a given spot falls below five, outlier rejection
in the coaddition process is not able to remove single-frame
events. In this example, a cometary debris trail from 81P/Wild (which would
have moved only slowly between consecutive scans, anyway) and seen only at W3 appears
at lower right. |
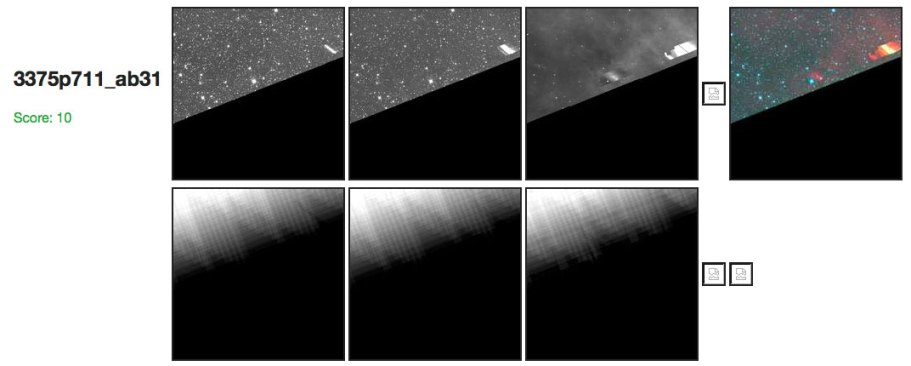 |
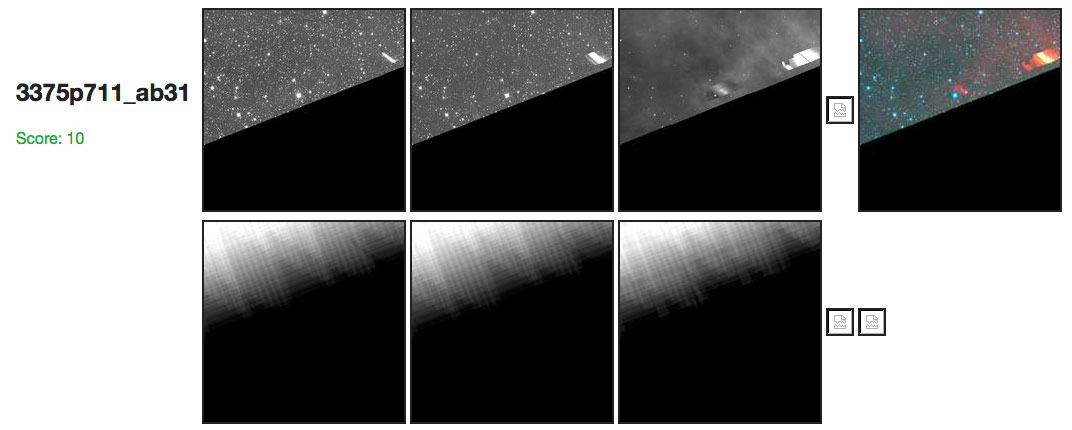
| Figure 19 - Atlas image 3375p711_ab31.
Coadds with areas of low coverage may have unusual features; when the
number of frames at a given spot falls below five, outlier rejection
in the coaddition process is not able to remove single-frame
events. In this example, a satellite trail visible in all three bands
is imprinted into the upper right of the coadd. |
 |
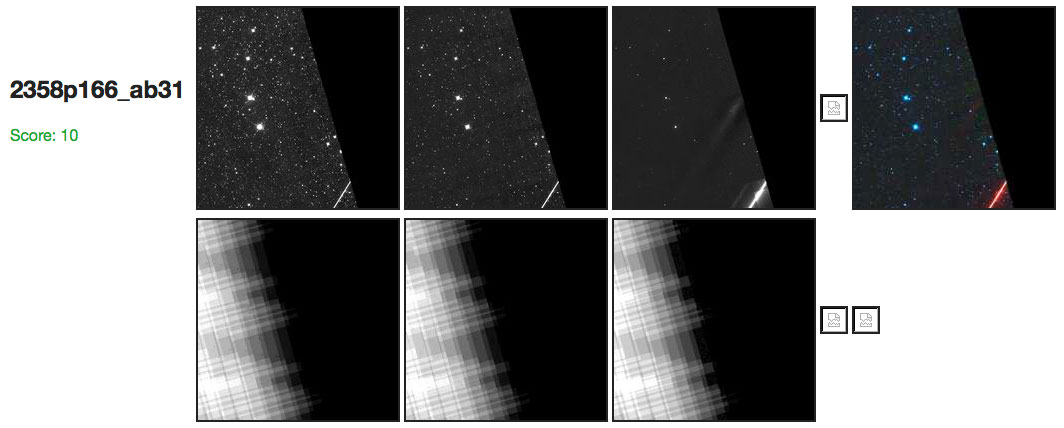
| Figure 20 - Atlas image 2358p166_ab31.
Coadds with areas of low coverage may have unusual features; when the
number of frames at a given spot falls below five, outlier rejection
in the coaddition process is not able to remove single-frame
events. In this example, a satellite trail seen in all three bands
appears at lower right; ghosts and latents from this trail are also
seen in W3. |
Last update: 5 July 2012