


WISE Atlas Tiles overlap adjacent Tiles by 180" in Declination and Right Ascension on the celestial equator. The RA overlap increases towards the equatorial poles. Positioning of the Tiles to cover the sky is described in IV.4.f.i.1. Source that fall within the Tile overlap region may be detected during Multiframe processing for each Tile, and thus may appear multiple times in the L3 WDB. These detections are redundant because the same Single-exposure frame images contribute to each overlapping Tile. The duplicate resolution process selects one entry from these duplicate source detections. The selected detection must also satisfy the Catalog selection criteria V.3.b to be in the Final Source Catalog.
This section details the duplicate resolution process which identifies one, unique detection of multiple-detected sources in the overlap regions. The selection is based purely on geometric criteria - select the detection that is furthest from its closest Tile edge. This distance to edge algorithm is the same algorithm used by 2MASS.
The process of identifying groups of positionally associated detections was performed using the Working Auto-Correlation software (WAX). WAX was originally designed for 2MASS to operate on very large data sets by partitioning the sky into declination-ordered bands to enable parallel processing. Although minor code adjustments were necessary to execute WAX on the WISE WDB, the core WAX algorithm remains the same. Detailed documentation for WAX is available.
WAX assigns every detection in the coverage area to a group, regardless of whether it is in an overlap region. Therefore, a group may have a single detection within the single Tile coverage region, or multiple detections within an overlap region where each detection is from a separate Tile. It is also possible for a group to have multiple detections within a non-overlap Tile coverage region. This occurs if there are multiple detections of more than one unique astrophysical source within the search radius from a single Tile, or the presence of spurious detections.
The Duplicate Resolution Process works on all groups throughout the coverage area.
Independent measurements of the positions of an inertial source will be spread over a small region because of natural measurement errors. The degree of spread is primarily a function of source signal-to-noise ratio, but can also be increased by systematic astrometric calibration errors, and confusion with nearby sources and transients such as cosmic rays and hot pixel events impinging on a source image. If the true position of a source was known a priori, then finding all available detections of it within a given WDB table would simply require searching a region around that position that was large enough to cover the expected spread in the individual sightings. Of course, a priori positions are not known, so WAX employed a detection density-directed search to identify spatially associated groups of extractions.
WAX processing began by making a pass through a WDB table to compute for each entry the centroid and density of a provisional group of extractions that lie within a specified angular distance from the initial entry, ri. The density is defined as the number of other extractions that fall within the search region, and the centroid is the average position of all provisional group members. For this step, relatively small (1") matching radii, ri, were used. This limit produced high reliability groupings at the expense of missing some real group members.
Next, the WDB entries were sorted into decreasing density order forming a queue of possible seeds. Final groups were then constructed from the queue of seeds as follows:
The density-ordered use of seeds is akin to peak finding in source detection algorithms, but results in extremely poor WDB access patterns (both to disk and in memory data). The algorithm therefore traverses the input data multiple times in spatial order, generating groups around the seeds encountered according to the following rules:
These rules result in identical output to the basic in-density-order algorithm described above, regardless of the order in which seeds are actually considered.
In some circumstances, the merging algorithm assigned an extraction to more than one group. These extractions, and the groups containing them, are said to be confused. The grouping algorithm employed is conservative: if a detection can be associated with more than one group, then it is allowed to do so, and that detection and all of its containing groups are flagged as confused. No attempt was made to resolve confused groups to avoid introducing biases.
The group identification process lays down a set of sometimes overlapping circular regions on the sky, and is thus figuratively called the "swiss cheese" algorithm. Figure 1 illustrates the "swiss cheese" algorithm, and shows how confusion can arise. Panel (a) in the upper left shows the distribution of source extractions in a small region of the sky that was observed multiple times. Each one of these extractions has an associated density and centroid computed from the first pass of WAX processing. The first group is identified in panel (b) having the highest density of any of the extractions, and all of the extractions in that group are removed from the list of seeds. The second group is found among the remaining seeds in panel (c), and its members are removed from the seed list. In panels (d)-(f), groups are generated around the remaining seeds that can incorporate extractions already assigned to another group.
 |
| Figure 1 - The "swiss cheese" algorithm for identifying spatially associated groups of extractions in the WISE WDB operating on a small region of the sky. (a) The raw extractions. (b-c) The first and second groups are generated. Unprocessed extractions are drawn in black, unconfused extractions and groups in light grey. (d-f) As more groups are generated, confusion - drawn in dark grey - appears. (from Monkewitz and Wheelock 2005) |
Source confusion occurs when a single Tile contributes more than a single detection to a group, i.e., when there are detections from more than one astrophysical source, or when a spurious detection is present. This is different from the WAX defined group confusion described above. All groups whether in an overlap region or a non-overlap region containing more than a single detection will proceed through the Duplicate Resolution algorithm.
The search radius used in WAX to generate the final associated groups, rf, was 2.5". It is large enough to recover virtually all possible detections of sources, but not so large as to be badly contaminated by detections of nearby sources, given the resolution of the WISE W1 Point Spread Function, described in IV.3.c.
Figures 2a and 2b show a histogram and corresponding cumulative histogram of source separation using sources selected from specific Atlas Tile and then matched to all other sources found in the database with 5" radius.
 |
 |
| Figure 2a - Histograms of all source matches within 5" search radius of selected sources from a single Atlas Tile. | Figure 2b - Cumulative histograms of all source matches within 5" search radius of selected sources from a single Atlas Tile. |
Not all detections associated with a group are included in the selection process. Some are flagged artifacts, some are too close to the Tile edge to obtain a reasonable aperture magnitude. A filter, which is applied prior to the distance to edge selection algorithm, eliminates most spurious sources.
| Filter Type | Magnitude | Artifact Flag | Distance to Tile Edge | Reject/Accept |
|---|---|---|---|---|
| clean | detected1 in at least one band | lower-case artflag or 0 in all detected bands | - | Accept |
| mixed | detected1 in multiple bands | lower-case artflag or 0 in at least one detected band and uppercase artflag in at least one detected band |
- | Accept |
| spurious | detected1 in at least one band | upper-case artflag in all detected bands | - | Reject |
| 4 band upperlimit | upper limits in all 4 bands | any | - | Reject |
| distance to edge | any | any | minimum distance to edge < 50" | Reject |
All groups that have more than a single detection, after filtering, go through the distance to edge algorithm. Since the image data contributing to the source detection in each Atlas Tile are the same, multiple detections of a source in the overlap region are considered redundant. A single detection is chosen from the redundant set to be a candidate for the Catalog. The selection is based on a distance to edge algorithm, choosing that detection which falls furthest from its closest Tile edge.
For each group of positionally-matched detections:
 |
 |
 |
 |
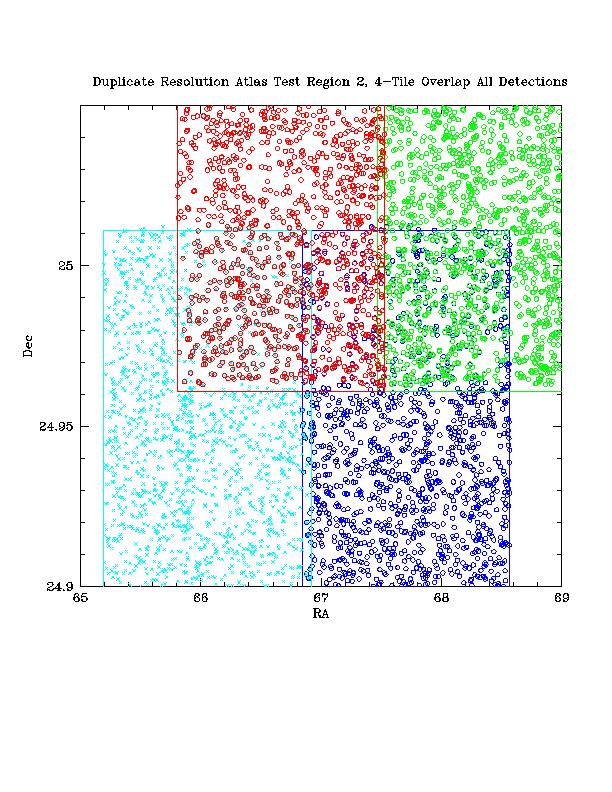
| Figure 3a - Detail Declination View Detections Only Atlas Test Region 2: 4-Tile Overlap |
Figure 3b - Detail Declination View Post Duplicate Resolution, all selected detections Atlas Test Region 2: 4-Tile Overlap |
Figure 3c - Detail RA View Detections Only Atlas Test Region 2: 4-Tile Overlap |
Figure 3d - Detail RA View Post Duplicate Resolution, all selected detections Atlas Test Region 2: 4-Tile Overlap |
Figure 3 shows the results of the distance to edge algorithm using a 4-Tile overlap area from the Atlas Test DB. Detections prior to selection are seen in Figures 3a (for detailed Dec view) and 3c (for detailed RA view) using color to associate all detections from a single Tile. The selected detections are seen in Figures 3b and 3d.
Last update: 2012 March 14